About the Distributive Pricing Indicator
The Distributive Pricing Forex Indicator for MT4 visualises where price has spent the most time and volume across a session.
It’s built for swing and intraday traders who want a simple, objective way to locate value zones, gauge institutional interest, and find low-risk entries.
The indicator auto-plots distribution bands and highlights zones where price is likely to revert or continue, making it faster to spot breakout traps and mean-reversion opportunities.
Free Download
Download the “distributive-pricing-indicator.mq4” indicator for MT4
Key Features
- Automatically plots distribution bands (high-density price areas) per session.
- Highlights fair-value zone (FVZ), high-volume nodes, and low-volume tails.
- Visual imbalance markers to spot potential breakout/continuation points.
- Configurable alerts for price entering or leaving the FVZ.
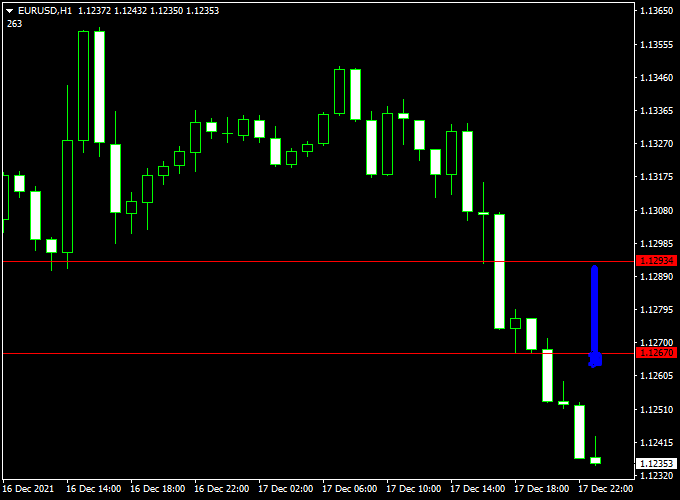
Indicator Example Chart (EUR/USD H1)
The example chart below showcases the Distributive Pricing MT4 indicator in action on the trading chart.

How To Trade Using This Indicator
Buy & Sell
- Buy: Price touches or slightly pierces the lower FVZ boundary and forms a bullish rejection candle.
- Confirm with higher timeframe support inside the same FVZ. Enter on the close of the confirmation candle.
- Sell: Price rallies to the upper FVZ boundary (or high-volume node) and shows bearish rejection (bearish engulfing, pin).
- For breakout failure, short when the price breaks above and then re-enters and fails to hold above the high-volume node.
Stop Loss and Take Profit
- Place stop loss beyond the opposite side of the distribution tail or a few pips beyond the recent swing high/low to protect against false breakouts.
- For mean-reversion targets, use the zone midpoint or the opposite FVZ edge.
- For breakout trades, aim for the next structural level or a fixed risk-to-reward of at least 1:2.
- Trail stops into the high-volume node when the move shows momentum.
The X Points Distributive Pricing MT4 Strategy
This strategy combines the X Points Forex Scalper Indicator with the Distributive Pricing Forex Indicator to create a dynamic and efficient trading system.
The Distributive Pricing indicator acts as a digital filter, identifying when the market is in a trending phase versus a ranging one.
The X Points Forex Scalper is a fast-acting signal generator, providing clear buy and sell points for quick, short-term trades.
By ensuring the market is trending before taking a scalping signal, this strategy significantly reduces the risk of whipsaws and false signals, which are common in ranging markets.
This system is best suited for time frames like M5 and M15 and is effective on any currency pair.
Buy Entry Rules
- The Distributive Pricing indicator shows the market is in a trending phase (e.g., price has broken out of a consolidation zone).
- The X Points Forex Scalper indicator displays a buy arrow signal.
- Stop Loss: Place your stop loss just below the most recent swing low or below the signal bar.
- Take Profit: Aim for a fixed target of 10-15 pips, or exit the trade when the X Points Forex Scalper provides an opposing sell signal.
Sell Entry Rules
- The Distributive Pricing indicator shows the market is in a trending phase (e.g., price has broken out of a consolidation zone).
- The X Points Forex Scalper indicator displays a sell arrow signal.
- Stop Loss: Place your stop loss just above the most recent swing high or above the signal bar.
- Take Profit: Aim for a fixed target of 10-15 pips, or exit the trade when the X Points Forex Scalper provides an opposing buy signal.
Advantages
- Filtered Signals: The strategy uses a strong filter to avoid trading in choppy markets, which is a common pitfall for scalping systems.
- High-Quality Entries: By combining a trend confirmation with a fast-acting signal, you can enter trades with a higher probability of success.
- Clear and Concise: The signals are visually straightforward to follow, making this system accessible to both new and experienced traders.
Drawbacks
- False Signals: Even with a filter, some false signals can occur, especially in low-volatility conditions.
- Requires Fast Execution: As a scalping strategy, it requires quick decision-making and execution. Delays can result in missing the optimal entry or exit point.
- Limited Opportunities: You must wait for the market to be in a confirmed trending phase. This can mean fewer trading opportunities compared to an unfiltered scalping system.
Case Studies
Case Study 1: Buy Trade
On an M5 chart for EUR/JPY, the price broke out of a tight consolidation range, and the Distributive Pricing indicator showed a new trend starting.
The X Points Forex Scalper then generated a blue arrow, signaling a buy. A buy trade was entered.
The price quickly moved up, hitting the 12-pip take-profit target within minutes, demonstrating the system’s effectiveness in a trending market.
Case Study 2: Sell Trade
On an M15 chart for GBP/USD, the price broke below a key support level, and the Distributive Pricing indicator confirmed a new downtrend.
The X Points Forex Scalper then gave a red arrow, signaling a sell.
A sell trade was opened with a stop loss placed above the previous swing high.
The price dropped sharply, and the trade was exited for a 15-pip profit as the X Points Scalper began to show a buy signal.
Strategy Tips
- Trade with the Trend: Always ensure the Distributive Pricing indicator confirms a trend before taking a signal. Never try to scalp against the trend with this system.
- Avoid High-Impact News: News releases can cause extreme volatility and sudden price swings. It is best to avoid trading 30 minutes before and after a major news event.
Download Now
Download the “distributive-pricing-indicator.mq4” indicator for Metatrader 4
Indicator Specifications
| Specification | Details |
|---|---|
| Platform | MetaTrader 4 (MT4) |
| Timeframes | All (recommended: H1, H4, D1) |
| Inputs |
|
| File | DistributivePricing.ex4 |
| License | Free download — personal use only |
FAQ
1. Can I use this indicator on lower timeframes (M5, M15)?
Yes — it will plot distribution based on the selected session, but expect more noise.
Use a higher timeframe filter (H1 or H4) to confirm the zone direction before taking quick M5/M15 entries.
2. How do I combine it with other indicators for higher probability trades?
Combine the Distributive Pricing Indicator with a momentum filter (RSI or MACD) and a trend filter (EMA 200).
Example: only take buys inside the lower FVZ when RSI is above 45 and price is above EMA200 on H4 — this avoids counter-trend entries.
3. What should I do when the price stays inside the FVZ for an extended period?
If price remains range-bound inside the FVZ, switch to a range strategy: trade fades from the zone edges with tight stops, or wait for a clear breakout from the distribution tail before committing to directional trades.
4. Can the indicator be used for longer-term swing trades?
Yes. Use daily and weekly timeframes to define large FVZs and align swing entries with those zones — entries near the edges of weekly distribution areas often provide excellent risk-to-reward.
Summary
The Distributive Pricing Indicator converts the complex idea of market distribution into clean, tradable zones.
For best results, combine it with a trend filter (EMA200), a momentum confirmation (RSI 14), and simple price-action on the zone edge.
A practical strategy: on H4, buy pullbacks to the lower FVZ only when the price is above EMA200 and RSI > 50; set SL below the zone tail and TP at zone midpoint for a conservative approach, or target the next structural resistance for higher reward.
This method keeps entries objective, reduces guesswork, and fits both intraday and swing workflows.


