
About the Double Moving Average Signal Indicator
The Double Moving Average Signal Indicator is a trend-following tool designed to simplify the identification of momentum shifts in the forex market.
While the visual layout may remind traders of the MACD, the underlying logic is built specifically around a dual moving average crossover system.
This indicator is particularly effective for traders who prefer visual clarity over complex chart lines.
It translates traditional moving average crossovers into a separate histogram window, using color-coded bars to represent bullish and bearish phases.
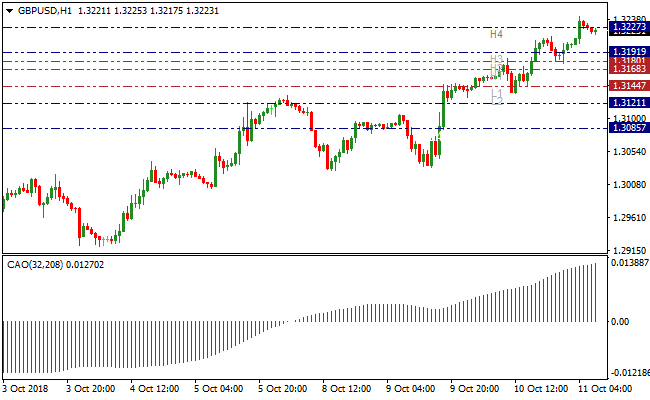
The default settings utilize a 32-period short MA and a 208-period long MA, making it highly suitable for capturing sustained medium to long-term trends.
Free Download
Download the “cao-indicator.mq4” MT4 indicator
Key Features
- Features a histogram-based display that identifies trend direction without cluttering the main price chart.
- Uses a crossover system based on short-term and long-term moving averages to generate signals.
- Provides clear color-coded bars to distinguish between bullish momentum and bearish pressure.
- Includes a zero-line reference to confirm the transition between different market cycles.
- Allows for full customization of the moving average periods to fit various trading styles.
- Supports multiple entries by highlighting trend pullbacks and resumptions within a larger move.
Indicator Chart
The Double Moving Average Signal Indicator is displayed in a dedicated window below the main price chart.
It features green and red bars that fluctuate around a central zero mark.
When both green and red bars align above the zero mark, it indicates a strong upward trend.
Conversely, when the bars align below the zero mark, it signals a dominant downward trend.
Guide to Trade with the Double Moving Average Signal Indicator
Buy Rules
- Wait for the bars to move from below the zero mark to above it.
- Open a buy position at the appearance of the very first green bar above the zero level.
- Identify secondary opportunities to add to your position if the bars change from red to green while remaining above zero.
- Ensure the price action on the main chart supports the bullish momentum before entry.
Sell Rules
- Monitor the indicator for the bars to shift from above the zero mark to below it.
- Execute a sell trade at the first red bar that forms below the zero level.
- Look for additional short entries if the histogram bars flip from green back to red while staying below the zero mark.
- Confirm the bearish signal with a breakdown of support or a lower high on the price chart.
Stop Loss
- Place the stop loss below the most recent swing low for long positions.
- Position the stop loss above the recent swing high for short positions.
- Maintain a stop level that allows for minor retracements while protecting your capital from a trend reversal.
Take Profit
- Target a fixed profit level based on a 1:2 risk to reward ratio.
- Consider exiting the trade when the bars cross back over the zero mark in the opposite direction.
- Close the position manually if the histogram bars consistently decrease in height, signaling fading momentum.
Double MA Signal + Trend Predictor Forex Strategy
This MT4 strategy combines the trend‑filtering power of the Double Moving Average Signal MT4 indicator with the precise entry timing provided by the Trend Predictor v1.0 MT4 arrows.
The strategy works well on M5 or M15 charts but can also be applied on H1 for more stable signals.
It is ideal for traders looking for clear trend-aligned entries with momentum confirmation.
By combining trend confirmation and entry signals, this strategy reduces false trades and increases the probability of successful moves.
Buy Entry Rules
- Confirm that the Double MA Signal histogram is above zero, indicating a bullish trend.
- Wait for a blue arrow from the Trend Predictor v1.0 indicator and enter a buy on the next candle open.
- Place a stop loss a few pips below the recent swing low or according to the pair’s volatility.
- Set take profit using dynamic ATR calculation, swing levels, or a fixed pip target depending on your timeframe.
Sell Entry Rules
- Confirm that the Double MA Signal histogram is below zero, indicating a bearish trend.
- Wait for a red arrow from the Trend Predictor v1.0 indicator and enter a sell on the next candle open.
- Place a stop loss a few pips above the recent swing high or according to volatility.
- Set take profit using dynamic ATR calculation, swing levels, or a fixed pip target depending on your timeframe.
Take Profit Rule
- Dynamic take profit: multiply the 14-period ATR by 1.5 to adapt to current volatility.
- Swing-based target: place take profit at the next significant swing high (long) or swing low (short) on a higher timeframe such as H1.
- Fixed pip target for scalping: 10–20 pips on M5 or lower, while maintaining at least a 1:1.5 risk/reward ratio.
Advantages
- Combines trend and momentum for more reliable trade signals.
- Dynamic take profit adapts to market volatility.
- Applicable on multiple timeframes, providing flexibility for scalping or swing trades.
- Helps reduce false trades by only entering with trend confirmation.
Drawbacks
- Lag in indicators can cause late entries in fast-moving markets.
- Shorter timeframes are sensitive to noise and spread widening.
- Dependent on two indicators, so overlapping signals or conflicting signals may occur.
- Requires careful monitoring of risk, especially in volatile sessions.
- Not ideal for illiquid or exotic currency pairs due to irregular price movements.
Example Case Studies
Case Study 1 (M5 Chart)
On EUR/USD, the Double MA histogram turned positive, signaling a bullish trend.
A blue arrow appeared from Trend Predictor, prompting a buy at 1.1230.
Stop loss was placed at 1.1224, and take profit at 1.1242 using ATR 1.5×.
The trade captured 12 pips in 12 minutes, demonstrating fast scalping potential.
Case Study 2 (H1 Chart)
On GBP/USD, the histogram dropped below zero, confirming a bearish trend.
A red arrow appeared from Trend Predictor.
A sell entry was placed at 1.3150, stop loss at 1.3170, and take profit at the previous swing low of 1.3080.
The trade netted approximately 70 pips over several hours, showing how the strategy can also capture higher timeframe trends.
Strategy Tips
- Use ATR or volatility filters to size stop loss and take profit appropriately for each pair and session.
- Focus on liquid major currency pairs for tighter spreads and more consistent execution.
- Consider scaling out: take partial profit at the first target, move stop to breakeven, and aim for a larger target with the remaining position.
- Keep risk per trade small (1–2% of account) to survive multiple trades per day.
- Backtest the strategy on a demo account to understand signal behavior across different volatility conditions.
- Combine with support and resistance or price action patterns for improved timing.
Download Now
Download the “cao-indicator.mq4” Metatrader 4 indicator
FAQ
Can I use different moving average periods for the Double Moving Average Signal Indicator?
Yes, the periods are fully adjustable.
While the default 32 and 208 settings are great for capturing long-term trends, day traders might prefer shorter periods like 12 and 50.
Experimenting with these settings allows you to align the indicator with the volatility of the specific pair you are trading.
What does it mean when the bars are above zero but change color?
When bars are above the zero mark, the long-term trend is bullish.
If the bars turn red while staying above zero, it indicates a temporary pullback or a weakening of the trend.
When they turn green again, it signals that the bullish momentum is resuming, offering a potential opportunity to join the trend at a better price.
Summary
The Double Moving Average Signal Indicator is a robust tool for any trader looking for a clear and objective way to follow the market trend.
Its histogram display takes the guesswork out of identifying crossovers, providing a straightforward visual guide for entries and exits.
By focusing on the relationship between two distinct moving averages, it helps you capture the meat of a market move while avoiding choppy price action.
Integrating this tool into your strategy can provide the extra layer of confirmation needed to trade with confidence.


