
About the DTOSC Signal Forex Indicator
The DTOSC Signal Forex Indicator for MT4 is a technical oscillator designed to identify overbought and oversold market conditions.
It helps traders anticipate potential price reversals and momentum shifts by analyzing internal price behavior rather than raw price movement alone.
The indicator is displayed in a separate MetaTrader 4 window and consists of two signal lines that move dynamically with market conditions.
These lines respond to changes in momentum and trend direction, allowing traders to monitor when bullish or bearish pressure begins to dominate.
DTOSC is flexible in its application.
It can be used as a standalone signal generator, as a timing tool for trade exits, or as a confirmation layer alongside other indicators.
Because it reacts to momentum extremes, it is especially useful for traders who want to avoid entering trades when price is already stretched.
Free Download
Download the “dtosc-indicator.ex4” indicator for MT4
Key Features
- Overbought and oversold oscillator for MT4
- Two dynamic signal lines that follow market momentum
- Visual crossover signals for trade timing
- Works on all currency pairs and timeframes
- Suitable for entries, exits, and confirmation
- Helps identify momentum shifts early
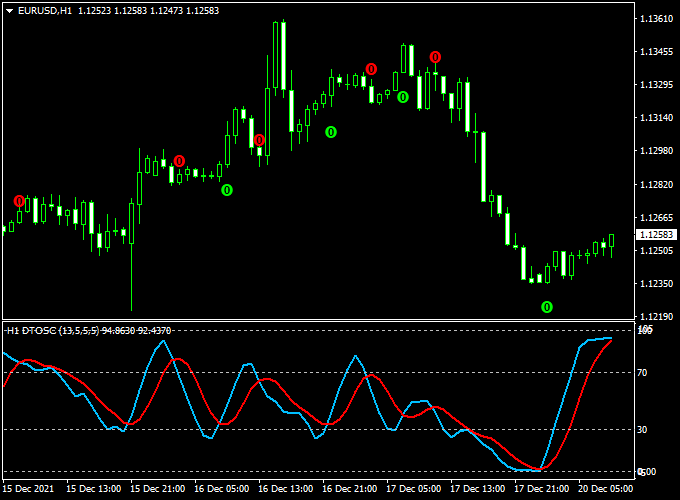
Indicator Chart
The chart below shows the DTOSC Signal Forex Indicator plotted in a separate MT4 window beneath the price chart.
Two colored signal lines move in response to changing market conditions.
In this example, bullish momentum is highlighted when the blue signal line crosses above the red line.
Bearish momentum becomes dominant when the red line moves above the blue line, helping traders time directional decisions.
Guide to Trade with the DTOSC Signal Forex Indicator
Buy Rules
- Wait for the blue colored signal line to cross above the red line
- Enter a buy trade after the crossover is confirmed
- Prefer signals that align with the broader market direction
Sell Rules
- Wait for the red colored signal line to cross above the blue line
- Enter a sell trade after the crossover is visible
- Focus on signals that follow prevailing momentum
Stop Loss
- Set the stop loss a few pips beyond the most recent swing point, opposite to your trade direction
- Adjust dynamically as new crossovers confirm momentum continuation
- Ensure stops are wide enough to accommodate normal market fluctuations without being too tight
Take Profit
- Target the next significant swing high for buys or swing low for sells
- Consider closing part of the position when the oscillator shows weakening momentum
- Trail the stop to follow the crossover line if the trend remains strong
Practical Tips
- Signals tend to perform better on M15 and higher timeframes
- Avoid trading during low-liquidity periods
- Use a higher timeframe direction as a directional filter
- Combine with basic price action for added confidence
DTOSC Signal Indicator + Zero Lag MA MT4 Forex Strategy
This strategy blends the DTOSC Signal Forex Indicator with a Zero Lag Moving Average in MT4.
DTOSC is an overbought/oversold oscillator that outputs signal line crossovers.
The Zero Lag MA filters for trend and reduce lag so that you trade with momentum more sharply.
Use this on 5-minute, 15-minute, or 30-minute charts for intraday moves. It is best for traders who want a mix of momentum signals and trend confirmation.
Buy Entry Rules
- Price must be above the Zero Lag Moving Average line (i.e., the trend is bullish).
- DTOSC’s blue signal line must cross above its red signal line (bullish crossover).
- Enter long at the close of the candle where the crossover is confirmed while the price remains above the Zero Lag MA.
- Stop Loss: Place stop below the recent swing low or a certain number of pips under entry (e.g., 10–30 pips depending on timeframe).
- Take Profit: Target 1.5×–2× risk or exit when DTOSC shows a bearish crossover or price closes below Zero Lag MA.
Sell Entry Rules
- Price must be below the Zero Lag Moving Average line (trend is bearish).
- DTOSC’s red signal line must cross above its blue signal line (bearish crossover).
- Enter short at the close of the candle, confirming that crossover while price is below Zero Lag MA.
- Stop Loss: Place stop above the recent swing high or a defined pip distance above entry.
- Take Profit: Target 1.5×–2× risk or exit when DTOSC gives a bullish crossover or price moves above the Zero Lag MA.
Advantages
- Combines momentum oscillator signals (DTOSC) with a smoother trend filter.
- Zero Lag MA helps reduce lag compared with standard moving averages.
- Clear entry and exit cues reduce indecision.
- Applicable across multiple intraday timeframes.
Drawbacks
- Zero Lag MA settings must be tuned; incorrect periods can lead to whipsaws.
- DTOSC crossovers in range markets may generate false signals.
- Lag in strong reversals — signals might come a little late.
Case Study 1 — EURUSD on 15m
On the EURUSD 15-minute chart, the price was trending above the Zero Lag MA line.
The DTOSC blue line crossed above the red line at 1.1205. A long entry was taken at 1.1207.
The stop was set 20 pips below at 1.1187.
Price moved up steadily and hit the 1.5× target (30 pips) at 1.1237 before the DTOSC gave a bearish crossover, at which point the position was closed.
Case Case Study 2 — GBPJPY on 5m
On GBPJPY 5-minute, the price was below the Zero Lag MA. DTOSC’s red line crossed above blue at 153.45, confirming bearish momentum.
A short was entered at 153.43 with a stop placed 15 pips above.
The trade slid downward, achieving 22 pips before a bullish DTOSC crossover triggered exit.
Strategy Tips
- Always check a higher timeframe trend (e.g., H1) before taking signals on lower timeframes.
- Avoid entering right before major news releases — volatility can spike and false crossovers may occur.
- Tweak the period setting of Zero Lag MA per instrument (e.g., 20, 50, or custom) to best align with volatility.
- Backtest the combination of DTOSC period settings and Zero Lag MA across major pairs to find reliable configurations.
By combining the DTOSC Signal with a well-parametrized Zero Lag Moving Average, you get a balanced momentum + trend filter system on MT4.
Refine parameters and follow strict risk control to improve performance across pairs and sessions.
Download Now
Download the “dtosc-indicator.ex4” indicator for Metatrader 4
FAQ
What type of indicator is DTOSC?
DTOSC is an oscillator focused on identifying overbought and oversold conditions through momentum-based signal lines.
Does DTOSC repaint signals?
Once a candle is closed, the signal line crossover remains fixed. This allows traders to base decisions on confirmed data.
Can DTOSC be used for trade exits?
Yes, many traders use opposite line crossovers as an exit signal to lock in profits or limit losses.
Summary
The DTOSC Signal Forex Indicator for MT4 offers traders a practical way to monitor momentum extremes and directional shifts.
By focusing on signal line behavior rather than raw price movement, it provides useful timing cues for both entries and exits.
Its adaptability across markets and timeframes makes it suitable for a wide range of trading styles.


