
The dynamic Support & Resistance indicator for Metatrader 5 add dynamic S & R levels on the price chart that can be utilized for accurate breakout trading.
It pops up on the main chart window showing two horizontally aligned solid lines: a red line representing resistance and a green line representing support.
The indicator supports all time frames and trading instruments offered by your MT5 broker.
Trade logic:
- A breakout above the red resistance line generates a buy signal.
- A breakout below the green support line generates a sell signal.
The following indicator inputs can be modified: look back, accuracy, colors, and style.
Make yourself familiar with this technical indicator and test it first on a demo account until you fully understand how it works.
Download Indicator 🆓
dynamicresistancesupport.mq5 Indicator (MT5)
Chart Example
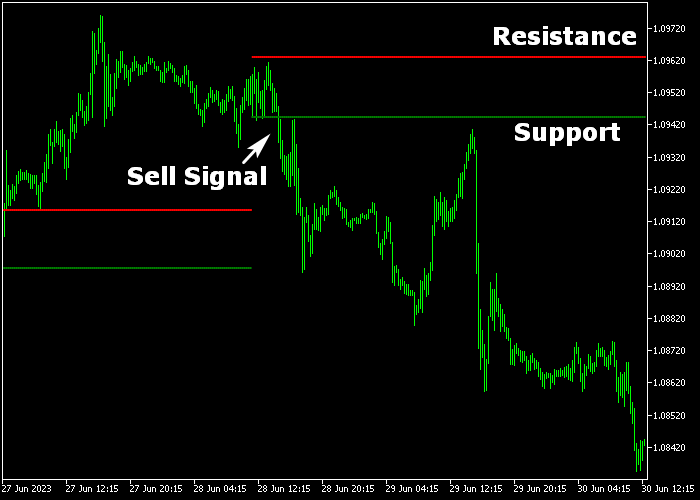
The picture below shows how the Dynamic Support & Resistance indicator looks like when applied to the MT5 chart.
How To Buy And Sell Forex Pairs With The Dynamic Support & Resistance Indicator?
Find a simple trading example below:
Buy Signal
- A buy signal is triggered when the candle closes above the upper red colored dynamic resistance line.
- Open a buy trade and place a stop loss order below technical swing support.
- Based on your chosen time frame, exit the buy trade to secure a profit ranging from 15 to 50 pips.
Sell Signal
- A sell signal is triggered when the candle closes below the lower green colored dynamic support line.
- Open a sell trade and place a stop loss order above technical swing resistance.
- Based on your chosen time frame, exit the sell trade to secure a profit ranging from 15 to 50 pips.
Download Now 🆓
dynamicresistancesupport.mq5 Indicator (MT5)
Frequently Asked Questions
How Do I Install This Custom Indicator On Metatrader 5?
- Open the MT5 trading platform
- Click on the File menu button located at the top left part of the platform
- Click on Open Data Folder > MQL5 folder > Indicators
- Copy the dynamicresistancesupport.mq5 indicator file in the Indicators folder
- Close and restart the trading platform
- You will find the indicator here (Navigator window > Indicators)
- Drag the indicator to the chart to get started with it!
How Do I Edit This Indicator?
- Click in the open chart with your right mouse button
- In the dropdown menu, click on Indicator List
- Select the indicator and click on properties
- Now you can edit the inputs, colors, levels, scale and visualization
- Finally click the OK button to save the new configuration


