The EFC Scanner indicator for Metatrader 4 is an amazing Forex dashboard indicator that delivers buy & sell signals for any currency pair and time frame.
It’s mainly based on price divergences and the RSI indicator.
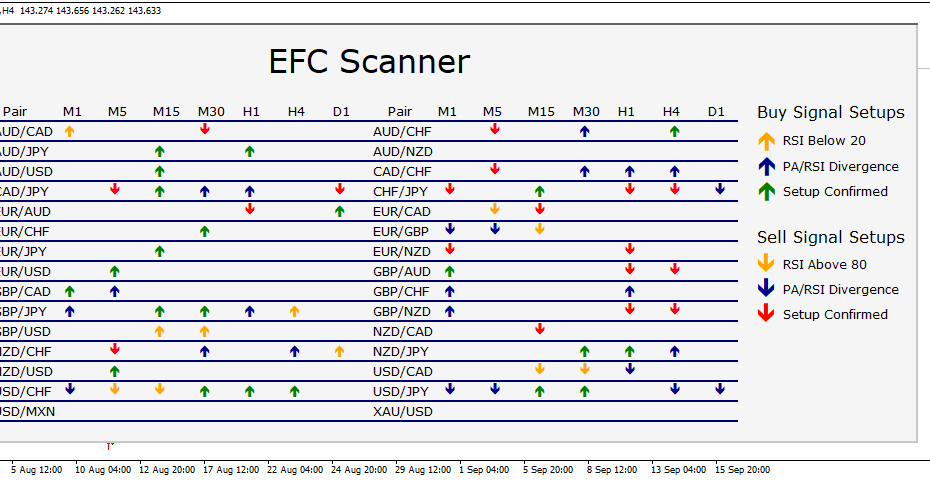
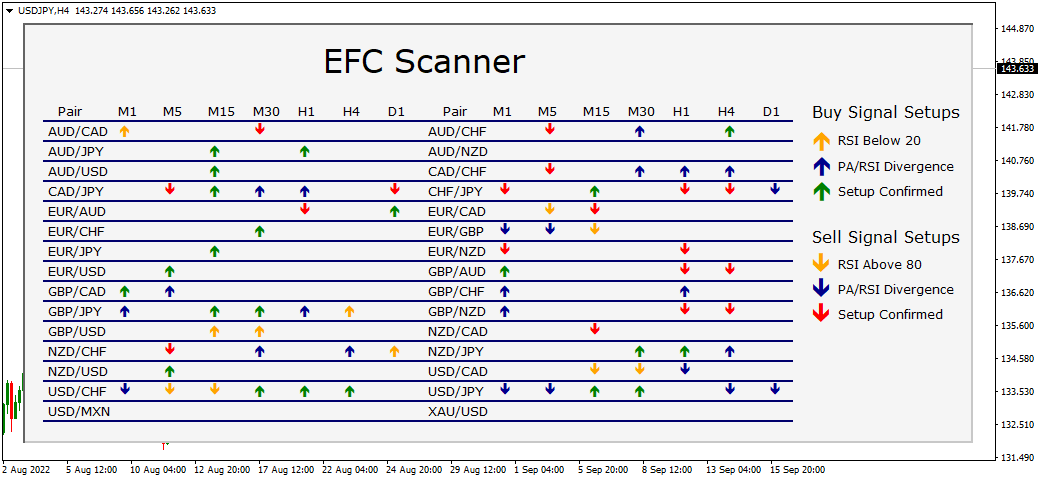
All signals appear in a beautiful dashboard as colored signal arrows. You can add up to 30 different currency pairs.
The green UP arrow is a confirmed buy setup signal, while the red arrow is a confirmed sell setup signal.
You can apply this system to any time frame, ranging from M1 charts up to the daily charts.
Key Points
- Delivers confirmed buy & sell signals
- Based on divergence + RSI
- Newbie friendly
- Well worth adding to your indicator collection
This indicator can work together with any existing trading strategy or system as a buy & sell trend confirmation tool.
Free Download
Download the “EFC-Scanner.ex4” MT4 indicator
Trading Chart
The USD/JPY 4-hour chart below shows the EFC Scanner indicator in action.
Trading Signals from EFC
BUY:
Open a buy trade as soon as the green colored “setup confirmed” arrow appears in the EFC scanner dashboard.
SELL:
Open a sell trade as soon as the red colored “setup confirmed” arrow appears in the EFC scanner dashboard.
Download Now
Download the “EFC-Scanner.ex4” MT4 indicator
Enhanced Trading Strategy: Combining EFC Scanner with Price Action Pattern Scanner
Overview
To improve the reliability of trade signals, this strategy integrates the EFC Scanner with the Price Action Pattern Scanner.
While the EFC Scanner identifies potential reversal points using RSI divergences, the Price Action Pattern Scanner confirms these signals by detecting specific candlestick patterns, reducing false entries.
Required Indicators
- EFC Scanner: Detects buy and sell opportunities based on RSI divergence.
- Price Action Pattern Scanner: Identifies key candlestick patterns such as pin bars, engulfing bars, and inside bars.
Trading Rules
Buy Setup
- Wait for the EFC Scanner to display a green “setup confirmed” arrow, indicating a potential buy signal.
- Check the chart for a bullish candlestick pattern highlighted by the Price Action Pattern Scanner (e.g., bullish pin bar or bullish engulfing pattern).
- If both conditions are met, enter a long position.
- Place a stop loss below the recent swing low.
- Set a take profit target at a risk-to-reward ratio of at least 1:2 or exit when an opposite signal appears.
Sell Setup
- Wait for the EFC Scanner to display a red “setup confirmed” arrow, indicating a potential sell signal.
- Check the chart for a bearish candlestick pattern highlighted by the Price Action Pattern Scanner (e.g., bearish pin bar or bearish engulfing pattern).
- If both conditions are met, enter a short position.
- Place a stop loss above the recent swing high.
- Set a take profit target at a risk-to-reward ratio of at least 1:2 or exit when an opposite signal appears.
Tips for Implementation
- Apply this strategy on higher time frames (H1 and above) to filter out market noise.
- Use additional tools like support and resistance levels to identify optimal entry and exit points.
- Always test the strategy on a demo account before applying it to live trading.
Strategy Conclusion
By combining the EFC Scanner’s divergence-based signals with the Price Action Pattern Scanner’s candlestick pattern confirmations, traders can enhance the accuracy of their entries and exits.
This integrated approach aims to provide more reliable trading opportunities in various market conditions.
Adjustable Parameters & Settings
Alerts, add/remove currency pairs, colors, and style
Feel free to explore the indicator’s different parameters and settings to create your own personalized indicator setup.
Technical Information
Currency Pairs: works on any currency pair
Trading Platform: developed for Metatrader 4 (MT4)
Time Frames: any
Indicator Type: dashboard signals
Final Thoughts
The EFC Scanner Forex Indicator for MT4 is a comprehensive dashboard tool that simplifies multi-currency analysis.
By highlighting buy and sell signals based on RSI divergences, it offers traders a clear overview of potential opportunities across various timeframes.
The color-coded arrows—blue for buy and red for sell—make it easy to interpret signals at a glance.
Its versatility allows for customization, enabling traders to monitor up to 30 different currency pairs simultaneously.
When combined with other indicators, such as the Price Action Pattern Scanner, the EFC Scanner can enhance trading strategies by confirming signals with candlestick patterns.


