About the Fibonacci Pivot Lines Indicator
The Fibonacci Pivot Lines Indicator for MT4 calculates and plots a central Fibonacci pivot point along with multiple support and resistance levels directly on the price chart.
These levels help traders assess trend direction, key reaction zones, and potential profit targets.
The Indicator automatically draws Fibonacci-based support levels labeled FS1, FS2, and FS3, as well as resistance levels labeled FR1, FR2, and FR3.
This layout provides a structured framework for planning entries, exits, and trade management.
Market bias is defined by price location relative to the pivot point.
Price trading above the pivot suggests bullish conditions, while price trading below it signals bearish conditions.
The Indicator can be used on its own or combined with other technical tools and price action analysis.
Free Download
Download the “fibonacci-pivot-lines.mq4” MT4 indicator
Key Features
- Automatically plots Fibonacci pivot points.
- Displays multiple support and resistance levels.
- Helps define bullish and bearish market bias.
- Useful for entries, exits, and profit targeting.
- Works across scalping, intraday, and swing trading.
- Compatible with other technical analysis methods.
Indicator Chart
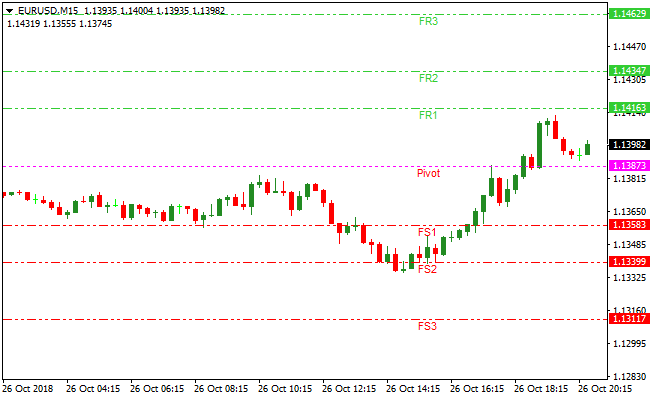
The image below shows the Fibonacci Pivot Lines Indicator applied to the price chart.
Pivot, support, and resistance levels are clearly displayed, allowing traders to track trend direction and plan trade exits around Fibonacci-based price zones.

Guide to Trade with the Fibonacci Pivot Lines Indicator
Buy Rules
- Wait for the price to close above the Fibonacci pivot point.
- Confirm bullish price behavior after the breakout.
- Enter a buy trade once the candle closes above the pivot.
- Trade in the direction of higher-timeframe bias when possible.
Sell Rules
- Wait for the price to close below the Fibonacci pivot point.
- Confirm bearish price behavior after the breakdown.
- Enter a sell trade once the candle closes below the pivot.
- Avoid countertrend trades near major news events.
Stop Loss
- Set the stop loss just beyond the pivot point after entry.
- Add a small buffer to account for intraday price spikes.
- Tighten the stop once price moves decisively toward the first target.
Take Profit
- For buy trades, close positions at resistance levels FR1, FR2, or FR3.
- For sell trades, close positions at support levels FS1, FS2, or FS3.
- Scale out positions as price reaches each Fibonacci level.
- Use an alternative exit method if momentum weakens early.
Day Trading Strategy Using Fibonacci Pivot Lines and HMA Mega Trend Indicator
This strategy combines the Fibonacci Pivot Lines MT4 indicator with the HMA Mega Trend indicator.
The Fibonacci Pivot Lines indicator shows the daily bias with its pivot point and the support and resistance zones.
The HMA Mega Trend indicator adds simple and clear entry signals through white and magenta arrows.
This setup works well for day trading because it uses strong directional levels together with clean intraday momentum signals.
Buy Rules
- Price must trade above the Fibonacci pivot point, which confirms a bullish daily bias.
- Wait for a white HMA Mega Trend arrow to appear.
- Enter the buy trade when the candle closes with the white arrow.
- Place the stop loss below FS1 or below the latest swing low.
- Take profit at FR1 or use a trailing stop when the move shows strength.
Sell Rules
- Price must trade below the Fibonacci pivot point, which confirms a bearish daily bias.
- Wait for a magenta HMA Mega Trend arrow.
- Enter the sell position when the candle closes with the magenta arrow.
- Place the stop loss above FR1 or above the latest swing high.
- Take profit at FS1 or trail the stop if the trend accelerates.
Advantages
- The pivot point gives a clear daily direction and helps avoid trading against the flow.
- The HMA Mega Trend arrows are clean and simple, which makes entries easy to read.
- The system builds on structure and momentum at the same time, which improves the quality of trades.
- The support and resistance zones make stop loss and take profit placement very precise.
Drawbacks
- Fast price spikes during major news can break through pivot levels quickly.
- The method works best in trending conditions. Slow sideways movement can reduce the accuracy of arrows.
Case Study 1. EURUSD London Open
EURUSD opened above the Fibonacci pivot point, indicating a bullish bias for the day.
During the London session, a white HMA Mega Trend arrow appeared near the pivot line.
A buy entry was taken after the candle closed. Price moved steadily higher and reached FR1.
The trade gained 28 pips before momentum slowed near FR2, which marked the exit.
Case Study 2. GBPUSD New York Session
GBPUSD traded below the pivot point in the early morning, showing a bearish direction.
Shortly after the New York open, a magenta arrow appeared with strong momentum.
A sell entry was taken, and the price moved down toward FS1 within a short period.
The trade gained 42 pips before buying pressure appeared near FS2.
The position was closed as the move lost strength.
Case Study 3. USDJPY Midday Reversal
USDJPY moved above the pivot point in the morning, signaling a bullish bias.
Later, a white arrow appeared and triggered a buy trade.
Price rose for a quick 18 pip push, then started to hesitate at FR1.
A trailing stop closed the trade for a 15 pip gain.
This shows how pivot levels can define realistic intraday targets even during shorter moves.
Strategy Tips
- Trade during the London or New York sessions when price moves are stronger.
- Use FR2 and FS2 only when volatility is high for bigger targets.
- Look at the previous day’s high and low to find extra support or resistance.
- Exit trades early if the price stalls near the pivot point to protect profits.
- Confirm momentum with the HMA Mega Trend arrow before entering.
- Keep position sizes moderate since day trades can move quickly.
- Review your trades at the end of each session to learn which setups work best.
- Focus on major currency pairs like EURUSD, GBPUSD, and USDJPY for more predictable moves.
Download Now
Download the “fibonacci-pivot-lines.mq4” Metatrader 4 indicator
FAQ
How does the pivot point define trend direction?
The pivot point acts as a balance level.
Price holding above it suggests bullish control, while price holding below it indicates bearish pressure.
Can this Indicator be used for scalping?
Yes. Many traders apply it on lower timeframes to scalp reactions around the pivot and nearby Fibonacci levels.
Are the support and resistance levels adjustable?
The levels are calculated automatically using Fibonacci formulas, but traders can combine them with manual levels for added precision.
Does it work well with other Indicators?
The Indicator pairs well with momentum tools, trend filters, and price action techniques to improve timing and confirmation.
Summary
The Fibonacci Pivot Lines Indicator offers a structured way to analyze trend direction and key price levels using Fibonacci calculations.
Its clearly plotted levels support disciplined trade planning.
By combining trend bias with predefined profit zones, it fits scalping, day trading, and swing trading strategies.
Results often improve when used alongside confirmation tools and sound risk management.


