About the FIJI BB Alert Forex Indicator
The FIJI BB Alert Indicator for MT4 is a trend-following tool designed to identify precise trade entries and exits within a Bollinger Bands channel.
It provides visual signals for both bullish and bearish trades, making it easier for traders to act on opportunities as they occur.
Displayed directly on the main MT4 chart, the indicator shows a dynamic trend channel with colored buy and sell dots.
These signals help traders enter trades in line with the market trend and exit at optimal points, improving timing and trade accuracy.
Free Download
Download the “fiji-bb-alert.ex4” indicator for MT4
Key Features
- Trend-following Bollinger Bands channel plotted on the chart
- Colored buy (blue) and sell (white) signals for easy trade identification
- Signals are generated in real time as price interacts with the channel
- Clear exit strategy using the opposite BB channel band
- Helps traders capture trends while minimizing false entries
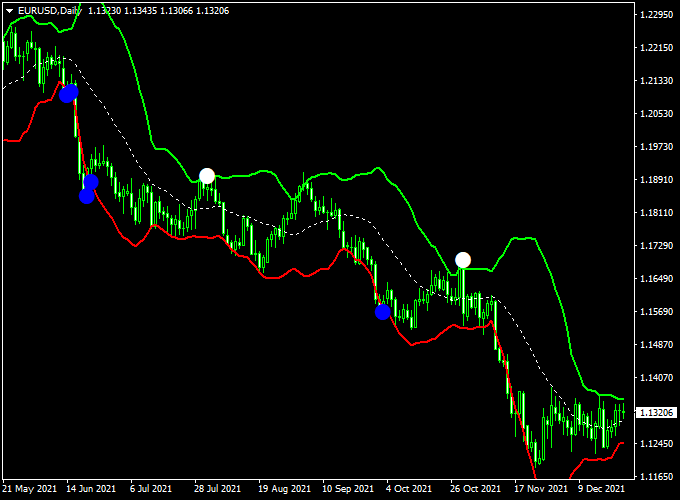
Indicator Chart
The chart example shows the Bollinger Bands channel with blue and white dots signaling buy and sell trades.
Traders can observe the trend direction and identify entry points aligned with momentum.
The channel boundaries serve as natural targets for exiting trades, helping to manage risk effectively.

Guide to Trade with the FIJI BB Alert Indicator
Buy Rules
- Look for a blue dot signal appearing while the channel is moving upwards.
- Confirm that the price is maintaining momentum above the middle of the channel.
- Enter a buy trade at the opening of the next candle after the signal appears.
- Optionally, check for supporting indicators such as RSI or moving averages to increase confidence.
Sell Rules
- Look for a white dot signal while the channel is trending down.
- Ensure price remains below the middle Bollinger Band or shows downward momentum.
- Enter a sell trade at the next candle’s open.
- Combining with trend indicators can reduce false entries in sideways markets.
Stop Loss Placement
- For buy trades, place the stop just below the lower channel line or recent swing low.
- For sell trades, place the stop just above the upper channel line or recent swing high.
- Adjust stop distance depending on volatility and timeframe to avoid premature exits.
Take Profit Targets
- Use the opposite Bollinger Band as the primary take profit level.
- Partial exits at the mid-channel line can lock in early profits while letting the trade run.
- For strong trends, consider using a trailing stop to maximize gains as the price moves favorably.
Practical Trading Tips
- Focus only on trades that follow the direction of the channel for higher probability setups.
- Avoid taking signals when the channel is flat or during major news events to prevent false breakouts.
- Observe the speed of channel expansion; stronger momentum often results in longer moves.
- Customize dot colors and channel settings for clearer visualization on your chart.
Fiji BB Alert Indicator + RSI with Bollinger Bands Forex Trend Reversal Strategy for MT4
This MT4 scalping strategy combines the Fiji BB Alert Indicator with the RSI with Bollinger Bands Trend Reversal Indicator.
It works well on short timeframes like the M5 and M15 charts.
This combination is designed for traders who like fast entries and quick profits by following clear visual signals from both indicators.
Fiji BB Alert provides breakout dots and channel direction, while the RSI with Bollinger Bands Trend Reversal Indicator confirms reversals with arrows.
Buy Entry Rules
- Wait for a blue dot to appear on the Fiji BB Alert Indicator and ensure the channel is trending up.
- Confirm a green arrow from the RSI with the Bollinger Bands Trend Reversal Indicator appears on the chart.
- Open a buy trade at the next candle open after both signals align.
- Set the stop loss just below the lower Bollinger Band or the recent swing low.
- Take profit at the opposite Bollinger Band channel or at a fixed pip target, such as 15–25 pips on M5.
Sell Entry Rules
- Wait for a white dot to appear on the Fiji BB Alert Indicator and ensure the channel is trending down.
- Confirm a red arrow from the RSI with the Bollinger Bands Trend Reversal Indicator appears on the chart.
- Open a sell trade at the next candle open after both signals align.
- Set the stop loss just above the upper Bollinger Band or the recent swing high.
- Take profit at the opposite Bollinger Band channel or at a fixed pip target, such as 15–25 pips on M5.
Advantages
- Clear visual signals reduce guesswork.
- Works well on fast-moving markets during London or New York sessions.
- Combines breakout and reversal logic for higher accuracy.
- Can be adapted for different timeframes with minor adjustments.
Drawbacks
- False signals may occur during flat or ranging markets.
- Requires quick execution due to the fast nature of scalping.
- Short targets mean spreads and commissions can eat into profits if not monitored.
Case Study 1 – EUR/USD M5
On the EUR/USD 5-minute chart, a blue dot appeared on the Fiji BB Alert Indicator with an uptrend channel.
A green arrow from the RSI Bollinger Bands Trend Reversal Indicator followed two candles later.
A buy trade was opened at 1.0840 with a stop loss at 1.0820 and a take profit at the opposite band at 1.0870.
The trade reached the target in 20 minutes, generating 30 pips profit.
Case Study 2 – GBP/USD M15
On the GBP/USD 15-minute chart, a white dot signaled a downtrend on the Fiji BB Alert Indicator.
The RSI Bollinger Bands Trend Reversal Indicator printed a red arrow shortly after.
A sell trade was placed at 1.2615 with a stop loss at 1.2645 and take profit at the opposite band at 1.2570.
The move produced a 45-pip gain within one hour.
Strategy Tips
- Use this strategy during active market sessions for stronger moves.
- Apply a trailing stop once the trade is in profit to lock in gains.
- Avoid trading just before high-impact news events, as volatility can cause false signals.
- Experiment with different timeframes to find your optimal setup.
Download Now
Download the “fiji-bb-alert.ex4” indicator for Metatrader 4
FAQ
How does the FIJI BB Alert indicator determine trade signals?
The indicator generates buy and sell dots based on price movements within the Bollinger Bands channel.
Signals appear when the price aligns with the prevailing trend and crosses the relevant level for entry.
Can it be used on multiple timeframes?
Yes. While ideal for short-term trades, it can also be applied on higher timeframes like H1 or H4 to capture longer trend moves.
Do the signals repaint or change after appearing?
No. Once a signal dot is generated, it stays fixed on the chart, allowing traders to take immediate action without uncertainty.
Summary
The FIJI BB Alert Indicator for MT4 simplifies trading by combining a trend-following Bollinger Bands channel with clear buy and sell dots.
Traders can enter positions in line with the trend and exit at logical channel boundaries, improving timing and trade efficiency.
Designed for both beginners and advanced traders, it provides a reliable method for spotting trend-based opportunities.
By integrating it with additional trend or momentum indicators, users can enhance accuracy, manage risk effectively, and increase the probability of profitable trades.


