
The Flat Trend Forex indicator designed for Metatrader 5 is quite an interesting tool that reveals 3 levels of market trend strength.
The indicator is shown in a dedicated chart as colored dots appearing at certain threshold levels.
How does it reveal the strength of the trend?
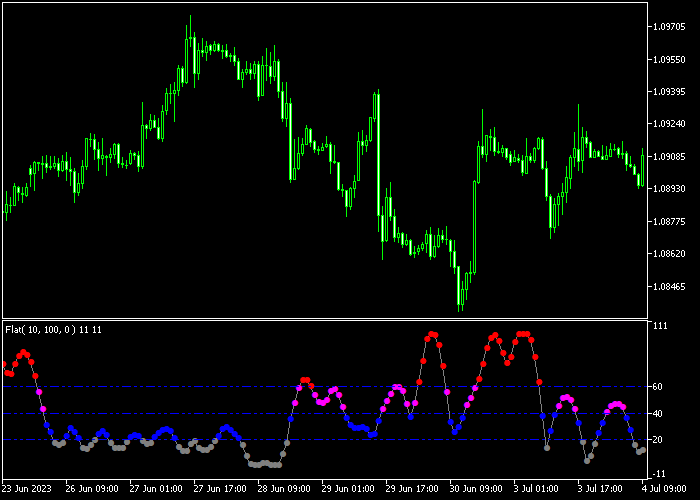
- An extremely strong market trend level occurs at the 60 threshold level and above.
- A strong market trend level occurs at the 40 threshold level and above.
- A weak market trend level occurs at the 20 threshold level and above.
- A sideways-moving market occurs below the 20 threshold level.
The indicator contains the following variables and parameters: smoothing period, smoothing type, price type, shift, style of line levels, colors, and threshold levels.
Make yourself familiar with the indicator and test it first on a demo account before applying it to a real trading account.
Download Indicator 🆓
Chart Example
The image below shows how the Flat Trend indicator looks like when applied to the MT5 chart.
How To Buy And Sell Currency Pairs Utilizing The Flat Trend Indicator?
The Flat trend indicator does not generate specific buy or sell signals for trading.
Incorporate it with other technical indicators or an established trading strategy of your choice.
By doing so, you can potentially obtain valuable insights that will help you decide whether to stay in a trade, take profits, or cut losses.
Download Now 🆓
Frequently Asked Questions
How Do I Install This Custom Indicator On Metatrader 5?
- Open the MT5 trading platform
- Click on the File menu button located at the top left part of the platform
- Click on Open Data Folder > MQL5 folder > Indicators
- Copy the flat.mq5 indicator file in the Indicators folder
- Close and restart the trading platform
- You will find the indicator here (Navigator window > Indicators)
- Drag the indicator to the chart to get started with it!
How Do I Edit This Indicator?
- Click in the open chart with your right mouse button
- In the dropdown menu, click on Indicator List
- Select the indicator and click on properties
- Now you can edit the inputs, colors, levels, scale and visualization
- Finally click the OK button to save the new configuration


