
About the FNCD Forex Trend Indicator
The FNCD Forex Trend Indicator for MT4 is a beginner-friendly oscillator designed to identify short-term trends in the Forex market.
It works particularly well for scalping and intraday trading, providing frequent trade opportunities during active market sessions.
Displayed in a separate MT4 window, the indicator uses a yellow signal line and a red dotted line to show trend direction.
When the yellow line crosses above the red line, it signals upward momentum, while crossing below signals downward momentum.
This no-repaint tool helps traders react quickly to market changes and provides clear visual cues for timely trade entries.
Its simplicity makes it suitable for both new traders and experienced scalpers looking for consistent short-term signals.
Free Download
Download the “fncd-2-indicator.mq4” indicator for MT4
Key Features
- Beginner-friendly trend oscillator for short-term trading
- The yellow signal line crosses the red dotted line to indicate the trade direction
- Works on all currency pairs and multiple timeframes
- Provides frequent trade opportunities for scalping and day trading
- Easy-to-read signals for quick decision making
- Non-repainting design ensures reliable trend alerts
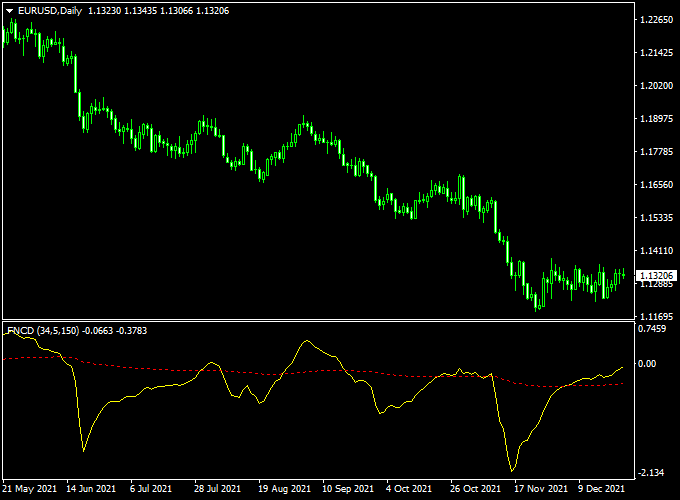
Indicator Chart
The chart shows the FNCD oscillator with a yellow line and a red dotted line.
Crosses of the yellow line above the red dotted line suggest buying opportunities, while crosses below suggest selling opportunities.
Traders can use these signals for precise entries aligned with short-term trend momentum.
Guide to Trade with FNCD Forex Trend Indicator
Buy Rules
- Enter a buy trade when the yellow line crosses above the red dotted line from below.
- Confirm the move with recent bullish candlesticks or trend patterns.
Sell Rules
- Enter a sell trade when the yellow line crosses below the red dotted line from above.
- Confirm the downward trend with recent bearish candlestick action.
Stop Loss Placement
- Buy trades: slightly below the recent consolidation area or minor support level.
- Sell trades: slightly above the recent consolidation area or minor resistance level.
- Alternatively, use ATR-based stops or a small fixed pip distance depending on your risk preference.
Take Profit Targets
- Set profit near nearby support or resistance zones depending on trade direction.
- Partial exits can be taken when the oscillator starts losing momentum.
- Trailing stops can help capture extended moves without manually adjusting positions.
Practical Trading Tips
- Best used during high-volume sessions like London or New York for more reliable signals.
- Adjust chart colors and line thickness for easier visualization.
- Focus on entries after clear crossovers to minimize false signals.
MT4 Day Trading Strategy: FNCD Trend + Flat Trend RSI
This strategy combines the FNCD Forex Trend Indicator with the Flat Trend RSI Indicator to capture trend direction and momentum in intraday trading.
The FNCD indicator is bullish when the yellow line crosses above the red dotted line and remains above zero, and bearish when it crosses below the red dotted line and stays below zero.
The Flat Trend RSI confirms momentum, printing blue histogram bars for bullish conditions and red bars for bearish.
By combining trend direction with momentum confirmation, traders can enter higher-probability trades on 5-minute, 15-minute, or 30-minute charts during the London and New York sessions.
Buy Entry Rules
- The FNCD trend indicator yellow line must cross above the red dotted line and stay above zero.
- Flat Trend RSI must print blue histogram bars indicating bullish momentum.
- Enter a buy order at the close of the confirming candle.
- Set stop loss a few pips below the recent swing low or below the nearest support level.
- Set take profit using intraday resistance levels or a 1.5:1 to 2:1 risk-reward ratio.
Sell Entry Rules
- The FNCD trend indicator yellow line must cross below the red dotted line and stay below zero.
- Flat Trend RSI must print red histogram bars indicating bearish momentum.
- Enter a sell order at the close of the confirming candle.
- Place a stop loss a few pips above the recent swing high or above the nearest resistance.
- Set take profit using intraday support levels or a 1.5:1 to 2:1 risk-reward ratio.
Advantages
- Combines trend direction (FNCD) with momentum confirmation (Flat Trend RSI) to reduce false signals.
- Effective on intraday charts for scalping or short-term day trading.
- Flexible take profit options allow adaptation to intraday support/resistance zones.
Drawbacks
- Signals may lag slightly in fast-moving markets.
- Sideways or low-volatility markets may produce choppy signals.
- Not suitable for long-term holding trades; best for intraday moves.
Case Study 1: EUR/JPY on 15-Minute Chart
During the London session, the FNCD indicator’s yellow line crossed above the red dotted line and remained above zero.
The Flat Trend RSI printed blue bars, so a buy trade was entered at 145.25.
The recent swing low was 145.10, and the stop loss was placed at 145.08, which represented a 17-pip risk.
The next resistance zone was at 145.55, so the take profit was set there, giving a potential gain of 30 pips.
Price moved upward steadily and reached the target, so the trade resulted in 30 pips profit.
Case Study 2: GBP/CHF on 5-Minute Chart
During the New York session, the FNCD yellow line crossed below the red dotted line and stayed below zero.
The Flat Trend RSI printed red bars, so a sell order was placed at 1.2110.
The recent swing high was 1.2122, and the stop loss was placed at 1.2125, giving a 15-pip risk.
The next support zone was around 1.2088, so the take profit was set there for a potential gain of 22 pips.
Price moved downward and hit the target, so the trade resulted in 22 pips profit.
Strategy Tips
- Always confirm trend direction on a higher timeframe (H1) before entering trades.
- Use this strategy on high-liquidity pairs to reduce spreads and slippage.
- Avoid trading during major economic news events.
- Consider trailing stops to lock in profits if the price moves strongly in your favor.
- Keep risk consistent (0.5–1% of account) per trade to manage capital effectively.
- Monitor price action near key support/resistance levels to adjust take profit levels accordingly.
Download Now
Download the “fncd-2-indicator.mq4” indicator for Metatrader 4
FAQ
How do the crossover signals work?
A buy signal occurs when the yellow line crosses above the red dotted line, indicating upward momentum. A sell signal occurs when it crosses below, showing downward momentum.
Can the indicator give false signals?
Short-term price noise can occasionally trigger a crossover. Combining it with price patterns or trend analysis reduces false entries.
How often do signals appear?
The oscillator provides frequent opportunities, making it ideal for scalping or intraday trades, especially during active market sessions.
Does the indicator repaint after a signal?
No. Once a crossover occurs, the signal remains fixed, allowing traders to act confidently without changes in past signals.
Summary
The FNCD Forex Trend Indicator for MT4 is a short-term trend oscillator that delivers quick, actionable signals through clear line crossovers.
Its frequent alerts make it ideal for scalpers and day traders seeking active trade opportunities.
By observing the crossover patterns and combining them with additional market analysis, traders can make well-informed entry and exit decisions.
Its simplicity and non-repainting design provide a reliable visual tool for monitoring short-term market trends.


