
About the Forex Index MTF Indicator
The Forex Index MTF Indicator for MT4 is a multi-timeframe oscillator designed to help traders monitor short-term trend direction across currency pairs.
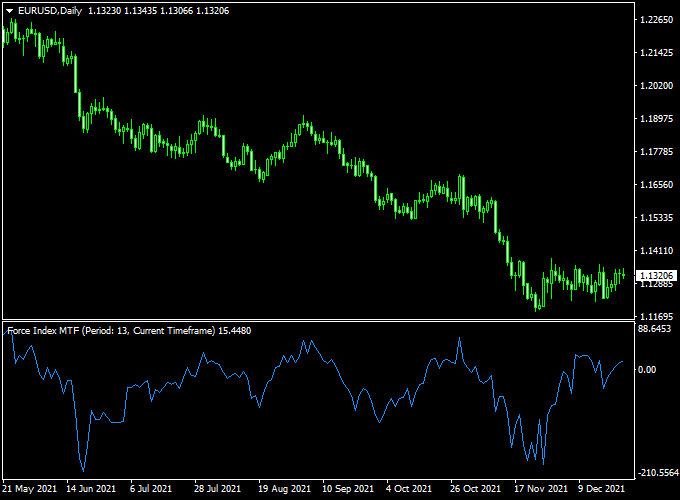
It swings above and below the 0.00 level to indicate bullish or bearish momentum, making it easy to spot potential trade opportunities.
Displayed in a separate MT4 chart window, the indicator’s blue signal line provides a clear visual cue for market direction.
Crosses above the 0.00 level suggest buying pressure, while crosses below indicate selling pressure.
This tool is particularly effective when paired with a longer-term trend indicator to filter trades and confirm the overall market direction.
Free Download
Download the “force-index_mtf.ex4” indicator for MT4
Key Features
- Multi-timeframe oscillator showing short-term trend direction
- Blue signal line crosses 0.00 for buy or sell signals
- Ideal for scalping and intraday trading sessions
- Can be combined with higher timeframe trend indicators for confirmation
- Non-repainting design ensures reliable signals
Indicator Chart
The chart displays the blue signal line oscillating above and below the neutral 0.00 level.
Crosses from bottom to top indicate potential buy entries, while crosses from top to bottom indicate potential sell entries.
Traders can use these movements to time short-term trades accurately.
Guide to Trade with Forex Index MTF Indicator
Buy Rules
- Open a buy trade when the blue signal line crosses above the 0.00 level.
- Check the previous few bars to confirm upward momentum.
- Optional: Ensure the longer-term trend aligns with the direction for higher probability trades.
Sell Rules
- Open a sell trade when the blue signal line crosses below the 0.00 level.
- Observe prior oscillator movement to confirm downward momentum.
- Optional: combine with a longer-term trend indicator to filter false signals.
Stop Loss Placement
- Buy trades: place below the nearest swing low or minor support area.
- Sell trades: place above the nearest swing high or minor resistance area.
Take Profit Targets
- Set profit near recent support/resistance levels or pivot points.
- Partial exits can be taken when the oscillator approaches the neutral line.
- Trailing stops allow capturing extended trends beyond the first target level.
Practical Trading Tips
- Focus on active trading sessions for stronger oscillator signals.
- Use higher timeframe trends to filter counter-trend entries.
- Combine with price action or support/resistance analysis to improve accuracy.
MT4 Scalping Strategy: Forex Index MTF + Volty Channel Signals
This scalping strategy combines the Forex Index MTF Indicator with the Volty Channel Signals Indicator to provide fast, high-probability intraday trades.
The Forex Index shows overall market momentum: bullish when the blue line is above zero and bearish when below.
The Volty Channel Signals indicator adds confirmation with colored signal lines in the main chart: blue for bullish and red for bearish.
This combination helps scalpers enter trades aligned with short-term market momentum on 1-minute, 5-minute, or 15-minute charts.
Buy Entry Rules
- The Forex Index blue line must be above zero, indicating bullish momentum.
- The Volty Channel Signals line must turn blue on the main chart.
- Enter a buy trade at the close of the confirming candle.
- Set stop loss a few pips below the most recent swing low or below the Volty channel support.
- Set take profit at the next minor resistance level, previous swing high, or channel top—not strictly based on risk-to-reward ratio.
Sell Entry Rules
- The Forex Index blue line must be below zero, indicating bearish momentum.
- The Volty Channel Signals line must turn red on the main chart.
- Enter a sell trade at the close of the confirming candle.
- Place a stop loss a few pips above the most recent swing high or above the Volty channel resistance.
- Set take profit at the next minor support level, previous swing low, or channel bottom, instead of using a fixed risk-to-reward target.
Advantages
- Combines momentum (Forex Index) with precise entry signals (Volty Channel), reducing false entries.
- Works well for scalping on lower timeframes with clear visual cues.
- Flexible take profit settings allow adaptation to market conditions and volatility.
- Easy to monitor visually for fast-paced intraday trades.
Drawbacks
- Signals can lag during extremely volatile spikes or news events.
- Not suitable for long-term trades; designed for scalping only.
- Requires quick execution and monitoring due to short timeframes.
Case Study 1: EUR/USD on 5-Minute Chart
During the London session, the Forex Index blue line rose above zero while the Volty Channel line turned blue. A buy trade was entered at 1.1025.
The recent swing low was 1.1018, which led to placing the stop loss at 1.1015 (10 pips risk).
The nearest resistance and previous swing high was at 1.1040, so the take profit was set there, providing a potential gain of 15 pips.
Price moved upward quickly and reached the target, resulting in a 15 pip profit.
Case Study 2: USD/JPY on 1-Minute Chart
During the New York session, the Forex Index blue line dropped below zero while the Volty Channel line turned red. A sell order was placed at 145.50.
The recent swing high was 145.62, which required placing the stop loss at 145.65 (15 pips risk).
The next support level was 145.35, so the take profit was set at that level for a 15-pip gain.
Price moved downward and hit the support level, providing 15 pips profit.
Strategy Tips
- Use this strategy on high-liquidity pairs to minimize slippage and spreads.
- Prefer trading during active sessions (London and New York) for better momentum.
- Adjust take profit according to minor support/resistance levels or channel tops/bottoms.
- Avoid trading during major news announcements that can spike volatility.
- Maintain consistent position sizing to manage risk and preserve capital.
Download Now
Download the “force-index_mtf.ex4” indicator for Metatrader 4
FAQ
How does the Forex Index MTF indicator generate signals?
Signals are generated when the blue line crosses the 0.00 level, indicating a shift in short-term market momentum.
Can it be used on multiple timeframes?
Yes. The indicator works on all timeframes, but it is designed to show short-term trend direction, so it is ideal for intraday trades.
Does it repaint after signals appear?
No. Once the blue line crosses the 0.00 level, the signal remains fixed, providing a reliable entry reference.
How should I combine it with other indicators?
For improved accuracy, pair it with higher timeframe trend indicators, pivot points, or support/resistance levels to filter false signals.
Summary
The Forex Index MTF Indicator for MT4 is a short-term oscillator that highlights bullish and bearish momentum through 0.00 line crossovers.
Its frequent signals make it suitable for scalping and intraday strategies.
By combining its signals with longer-term trend indicators or support/resistance levels, traders can enhance entry accuracy and manage risk effectively.
The non-repainting design ensures that signals remain reliable, providing a practical tool for short-term Forex trading.


