The Forex Sentiment Signal indicator for Metatrader 5 utilizes support and resistance levels to provide clear lag-free entry points to currency traders.
It appears in the price chart as horizontal sea-green, blue and magenta colored lines.
We are only concerned about the sea-green (resistance) and magenta (support) colored trade entry lines.
Here’s a breakdown of how the indicator functions:
- The sea-green colored line is used for buy trade entry.
- The magenta colored line is used for sell trade entry.
The indicator offers the following inputs and variables: chart period, draw comments.
Before utilizing the Forex Sentiment Signal indicator on a live trading account, it is advisable to initially test it on a demo account.
If you plan to use this indicator for scalping, consider these two useful tips:
- Minimize trading costs by applying the Forex Sentiment Signal indicator on currency pairs with lower spreads.
- Focus on trading during the most volatile trading hours, volatility often presents more frequent trading opportunities.
Download Indicator 🆓
Chart Example
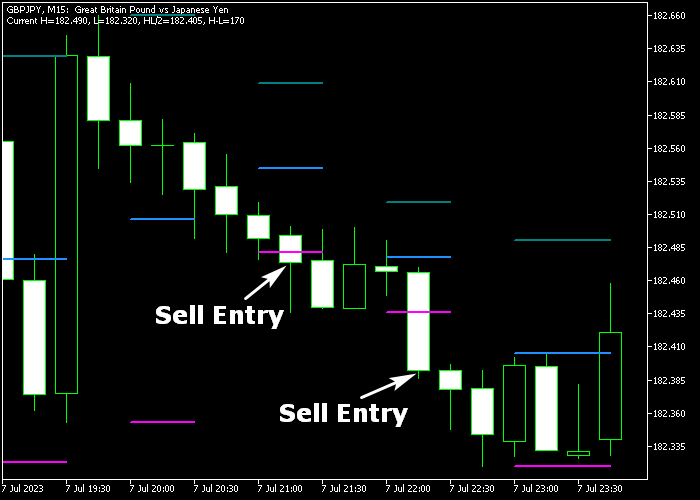
The picture below shows what the Forex Sentiment Signal indicator looks like when applied to the MT5 chart.

How To Buy And Sell Currency Pairs Using The Forex Sentiment Signal Indicator?
Find a simple trading strategy below:
Buy Signal
- A buy signal is confirmed when the candles close above the sea-green colored resistance line.
- Open a buy transaction and set your stop loss below the previous swing low level.
- Exit the buy trade for a fixed profit target of your preference.
Sell Signal
- A sell signal is confirmed when the candles close below the magenta colored support line (see chart example above).
- Open a sell transaction and set your stop loss above the previous swing high level.
- Exit the sell trade for a fixed profit target of your preference.
Download Now 🆓
Frequently Asked Questions
How Do I Install This Custom Indicator On Metatrader 5?
- Open the MT5 trading platform
- Click on the File menu button located at the top left part of the platform
- Click on Open Data Folder > MQL5 folder > Indicators
- Copy the hl.mq5 indicator file in the Indicators folder
- Close and restart the trading platform
- You will find the indicator here (Navigator window > Indicators)
- Drag the indicator to the chart to get started with it!
How Do I Edit This Indicator?
- Click in the open chart with your right mouse button
- In the dropdown menu, click on Indicator List
- Select the indicator and click on properties
- Now you can edit the inputs, colors, levels, scale and visualization
- Finally click the OK button to save the new configuration


