The Fractal Force Index indicator for Metatrader 5 follows short-term trends and quickly reacts to sudden trend changes and spikes in prices.
This indicator works best for making quick profits multiple times a day and fits both scalpers and intraday traders.
How to interpret this technical analysis tool?
- A buy trend occurs when the blue indicator line turns back above the 0 level from below.
- A sell trend occurs when the blue indicator line turns back below the 0 level from above.
The following indicator inputs and parameters can be modified according to your preferences: Fractal period, colors, style.
It is highly recommended to familiarize yourself with this indicator and thoroughly test it on a demo account before implementing it in live trading.
It supports all time frames and Forex pairs.
Download Indicator 🆓
Fractal_Force_Index.mq5 Indicator (MT5)
Chart Example
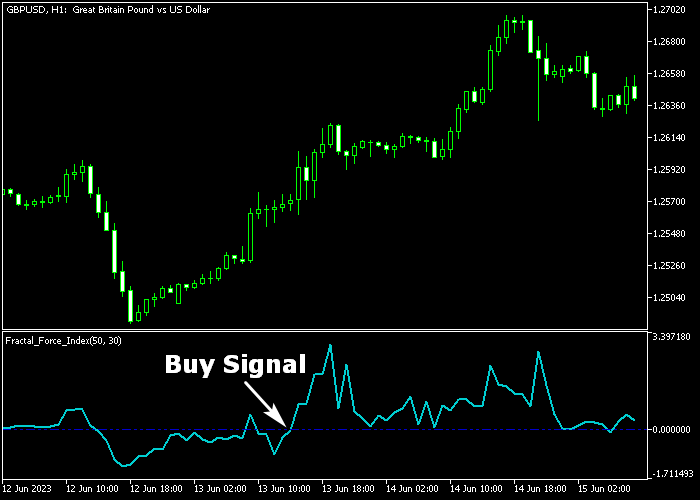
The following chart shows what the Fractal Force Index indicator looks like when applied to the MT5 chart.

How To Buy And Sell Currency Pairs With The Fractal Force Index Indicator?
Find a simple trading strategy below:
Buy Signal
- A buy signal is confirmed when the blue line crosses the 0 level bottom up.
- Execute a buy trade and place a protective stop loss below short-term support.
- Close the buy position for 5-20 pips potential profit, or wait for a sell signal.
Sell Signal
- A sell signal is confirmed when the blue line crosses the 0 level top down.
- Execute a sell trade and place a protective stop loss above short-term resistance.
- Close the sell position for 5-20 pips potential profit, or wait for a buy signal.
Download Now 🆓
Fractal_Force_Index.mq5 Indicator (MT5)
Frequently Asked Questions
How Do I Install This Custom Indicator On Metatrader 5?
- Open the MT5 trading platform
- Click on the File menu button located at the top left part of the platform
- Click on Open Data Folder > MQL5 folder > Indicators
- Copy the Fractal_Force_Index.mq5 indicator file in the Indicators folder
- Close and restart the trading platform
- You will find the indicator here (Navigator window > Indicators)
- Drag the indicator to the chart to get started with it!
How Do I Edit This Indicator?
- Click in the open chart with your right mouse button
- In the dropdown menu, click on Indicator List
- Select the indicator and click on properties
- Now you can edit the inputs, colors, levels, scale and visualization
- Finally click the OK button to save the new configuration