
About the FX Forecaster Oscillator Indicator
The FX Forecaster Oscillator Indicator is a technical analysis tool developed for the Metatrader 4 platform, specifically designed to anticipate short-term trend shifts in the forex market.
It utilizes a refined calculation based on the Moving Average Convergence Divergence (MACD) framework to provide a clearer view of momentum changes.
One of the primary benefits of the FX Forecaster Oscillator Indicator is its ability to filter out weak price action by requiring both histograms to align before a signal is confirmed.
This dual-layer validation process helps traders avoid entering the market during periods of low momentum or consolidation.
It is particularly effective for scalpers and intraday participants who need to react quickly to evolving price patterns.
The indicator is fully customizable, allowing users to adjust period settings to fit various currency pairs and market conditions.
Free Download
Download the “fx-forecaster.ex4” MT4 indicator
Key Features
- The indicator utilizes a dual-histogram system with purple and black bars.
- It delivers momentum signals based on a modified MACD algorithm.
- The zero-line threshold acts as a primary filter for bullish and bearish trends.
- The tool provides early warnings for potential short-term price reversals.
- It is optimized for high-frequency trading styles like scalping and day trading.
- The settings are fully adjustable via the inputs tab for personalized sensitivity.
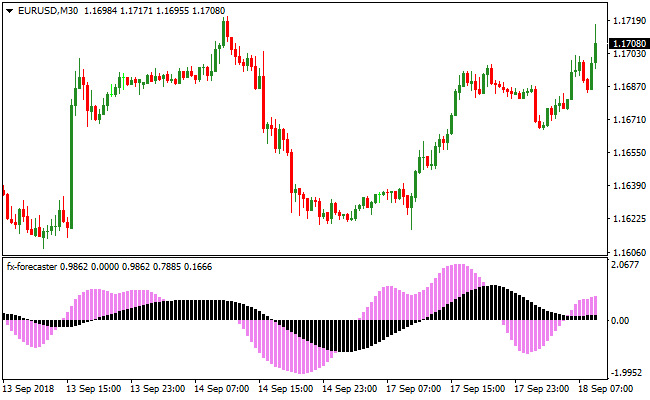
Indicator Chart
The chart displays the FX Forecaster Oscillator Indicator in the bottom sub-window, featuring purple and black histogram bars.
You can see how the bars fluctuate around the 0.00 zero level to indicate market bias.
When both histograms are positioned above the line, the market shows strong upward momentum.
Conversely, when both colors are visible below the zero line, it reflects a dominant bearish environment, helping traders time their entries with the prevailing short-term trend.
Guide to Trade with FX Forecaster Oscillator Indicator
Buy Rules
- Monitor the indicator window until both the purple and black histograms move above the zero line.
- Ensure the alignment is clear and both bars are growing in height for better momentum.
- Open a long position at the start of the next candle once the signal is confirmed.
- Avoid buying if only one of the two histograms is above the 0.00 level.
Sell Rules
- Watch for the moment both the purple and black histogram bars drop below the zero line.
- Confirm that both bars are fully aligned in the negative zone before taking action.
- Initiate a short trade position at the opening of the subsequent price candle.
- Ignore sell signals if one of the histogram colors remains above the central line.
Stop Loss
- For long trades, place your defensive stop just below the most recent local swing low.
- For short trades, position the stop loss several pips above the previous swing high.
- Alternatively, you can use a fixed volatility-based stop to protect your capital from sudden spikes.
Take Profit
- Exit the trade when one of the histograms crosses back to the opposite side of the zero line.
- Consider closing the position if the bars start to decrease in size, signaling weakening momentum.
- Use a set profit target based on a 1:1.5 or 1:2 risk-to-reward ratio for consistent results.
FX Forecaster Oscillator + Complete Fibonacci Signals Forex Breakout Strategy
This breakout strategy combines the FX Forecaster Oscillator for MT4 and the Complete Fibonacci Signals MT4 Indicator.
The FX Forecaster Oscillator confirms momentum: a buy signal occurs when both black and violet histogram bars are aligned above the zero line, and a sell signal occurs when both are aligned below zero.
The Complete Fibonacci Signals Indicator identifies key breakout levels: a buy trend is confirmed when price breaks above the “1 Hourly Long” level, while a sell trend is confirmed when price breaks below the “1 Hourly Short” level.
Combining these indicators allows traders to enter breakout trades with clear momentum confirmation and precise levels.
This strategy works well on M15 and H1 charts for day trading, and it can also be adapted for H4 for swing breakout trades.
It is suitable for major currency pairs and high-volatility sessions.
By aligning momentum with Fibonacci breakout levels, traders can reduce false breakouts and capture strong directional moves.
Buy Entry Rules
- FX Forecaster Oscillator black and violet histogram bars are aligned above the zero line.
- Price breaks above the “1 Hourly Long” level of the Complete Fibonacci Signals Indicator.
- Enter a buy trade immediately after the breakout candle closes.
- Place a stop loss below the nearest support level or below the breakout candle low.
- Take profit at the next resistance level or after a reasonable pip gain based on market volatility, typically 40–80 pips on H1 and 25–50 pips on M15.
Sell Entry Rules
- FX Forecaster Oscillator black and violet histogram bars are aligned below the zero line.
- Price breaks below the “1 Hourly Short” level of the Complete Fibonacci Signals Indicator.
- Enter a sell trade immediately after the breakout candle closes.
- Place a stop loss above the nearest resistance level or above the breakout candle high.
- Take profit at the next support level or after a reasonable pip drop based on market volatility, typically 40–80 pips on H1 and 25–50 pips on M15.
Advantages
- Combines momentum and precise Fibonacci breakout levels for higher-probability trades.
- Clear visual signals make it easy to spot breakout opportunities quickly.
- Adaptable to multiple timeframes (M15, H1, H4) for scalping, day trading, or swing trading.
- Helps avoid entering false breakouts by requiring confirmation from both momentum and level indicators.
- Effective on major currency pairs during high-liquidity sessions for smoother price action.
- Allows traders to capture strong directional moves with clear entry and exit rules.
Drawbacks
- False breakouts can occur if market volatility spikes unexpectedly.
- Requires active monitoring to enter trades immediately after breakout confirmation.
- Smaller pip gains on lower timeframes require multiple successful trades for significant profit.
Example Case Study 1
On EURJPY H1 during the London session, the FX Forecaster Oscillator black and violet bars were above zero, confirming bullish momentum.
Price broke above the “1 Hourly Long” Fibonacci level at 156.80.
A buy trade was entered at 156.82 with a stop loss at 156.55.
Price rallied to 157.35 within three hours, yielding 53 pips before the next trend reversal appeared.
Example Case Study 2
On AUDUSD M15 during the New York session, the FX Forecaster Oscillator bars aligned below zero, indicating bearish momentum.
Price broke below the “1 Hourly Short” Fibonacci level at 0.6615.
A sell trade was entered at 0.6614 with a stop loss at 0.6625.
Price dropped to 0.6588, providing 26 pips profit within one hour before a reversal signal appeared.
Strategy Tips
- Focus on major currency pairs with high liquidity for stronger breakouts and cleaner signals.
- Enter trades only after both momentum and Fibonacci breakout levels align for higher probability.
- Use H1 for stronger trend confirmation and M15 for faster intraday breakout opportunities.
- Adjust stop losses to recent support/resistance levels or breakout candle extremes to minimize risk.
- Take profits near significant support/resistance areas or when momentum shows signs of weakening.
- Avoid trading during major news releases to prevent sudden spikes from triggering false breakouts.
- Maintain a trading journal to track which pairs and timeframes perform best for this breakout strategy.
- Be patient and wait for proper breakout confirmation to reduce overtrading and false entries.
Download Now
Download the “fx-forecaster.ex4” Metatrader 4 indicator
FAQ
Is it best to use the FX Forecaster Oscillator Indicator alone?
While it can function as a standalone signal generator, many professional traders combine it with a trend-following tool like a 200-period Moving Average.
This allows you to only take buy signals in an uptrend and sell signals in a downtrend, which significantly enhances the overall quality of your trade setups.
Will the histogram bars repaint once the candle is closed?
The FX Forecaster Oscillator Indicator is designed to be non-repainting.
Once a candle closes and the histograms are fixed above or below the zero line, the signal will not change.
Summary
The FX Forecaster Oscillator Indicator is a robust tool for capturing short-term market momentum with high precision.
Its dual-histogram design provides a unique way to confirm that both price and momentum are aligned before committing to a trade.
By focusing on the zero-line crossovers and ensuring both histogram colors match, you can effectively filter out market noise.


