
The Gann Swing Forex indicator for Metatrader 5 provides swing support and resistance levels based on the Gann trading method.
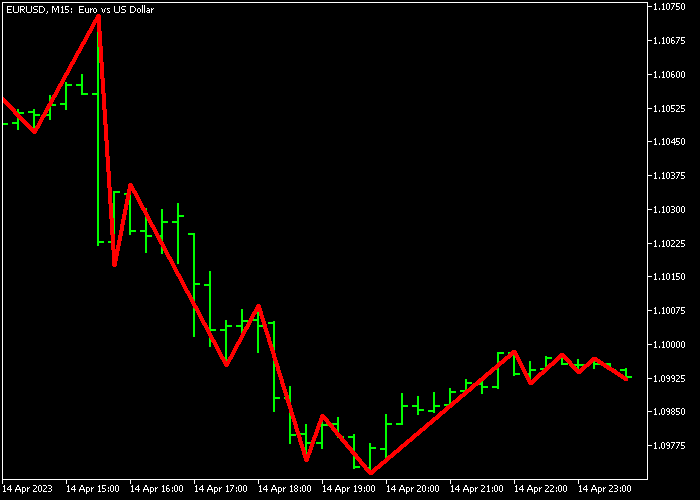
All support and resistance levels are connected by a thick red line (see chart).
How to interpret this S & R technical indicator?
- A rising Gann Swing indicator line indicates a bullish trend.
- A falling Gann Swing indicator line a bearish trend.
The Gann Swing indicator is most useful for stop loss placement and take profit levels.
How to place stop losses with the Gann Swing indicator?
- For buy trades, place your stop loss below the red colored Gann Swing indicator line.
- For sell trades, place your stop loss above the red colored Gann Swing indicator line.
The indicator contains the following inputs and parameters: style, and colors.
First, familiarize yourself with this technical indicator and test it on a demo account.
It supports all time frames and Forex pairs.
Download Indicator 🆓
Chart Example
The following chart shows how the Gann Swing indicator looks like when applied to the MT5 chart.
How To Buy And Sell Forex Pairs With The Gann Swing Forex Indicator?
The Gann Swing Forex indicator does not issue any buy or sell trading signals. Please combine with an existing trading strategy or system.
Download Now 🆓
Frequently Asked Questions
How Do I Install This Custom Indicator On Metatrader 5?
- Open the MT5 trading platform
- Click on the File menu button located at the top left part of the platform
- Click on Open Data Folder > MQL5 folder > Indicators
- Copy the GannSwing.mq5 indicator file in the Indicators folder
- Close and restart the trading platform
- You will find the indicator here (Navigator window > Indicators)
- Drag the indicator to the chart to get started with it!
How Do I Edit This Indicator?
- Click in the open chart with your right mouse button
- In the dropdown menu, click on Indicator List
- Select the indicator and click on properties
- Now you can edit the inputs, colors, levels, scale and visualization
- Finally click the OK button to save the new configuration


