
About the HeatMap, Gradient, and Scale Indicator
The HeatMap, Gradient, and Scale indicator for MT4 provides a visual overview of the daily percent change for all instruments in your market watch.
It appears directly on the main chart, allowing traders to see which assets are trending and which are moving sideways at a glance.
Colors and layouts can be fully customized in the indicator settings to match your trading preferences.
This tool is useful for traders who monitor multiple pairs or instruments and want a quick, easy-to-read performance snapshot.
Free Download
Download the “HeatMap-Gradient-Scale.mq4” indicator for MT4
Key Features
- Displays daily percent change for all market watch instruments
- Color-coded display highlights trending and sideways assets
- Fully customizable colors and layout
- Works on all MT4 timeframes
- Ideal for multi-pair or multi-asset trading
- Helps spot strong trends and consolidation quickly
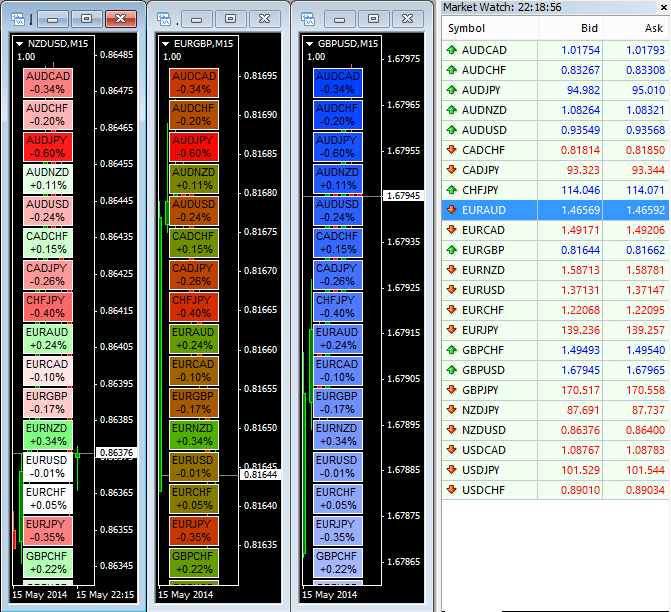
Indicator Chart
The chart shows the HeatMap, Gradient, and Scale indicator applied to an MT4 chart.
Each instrument is color-coded based on daily percent change, making it easy to spot trends.
Traders can use this overview to focus on the strongest opportunities or avoid sideways markets.
Guide to Trade with HeatMap, Gradient, and Scale Indicator
Buy Rules
- Focus on assets showing strong positive daily change
- Confirm trend using additional indicators or price action
- Consider entering long positions when other signals align
Sell Rules
- Focus on assets showing strong negative daily change
- Confirm downward trend with additional tools
- Enter short positions when multiple confirmations are present
Stop Loss
- Place stops below recent swing lows for buys
- Place stops above recent swing highs for sells
- Adjust based on volatility and timeframe
Take Profit
- Set targets at key support/resistance levels
- Take partial profits when momentum slows
- Use trailing stops for strong trending assets
Practical Tips
- Use the indicator to identify the strongest trending or consolidating instruments
- Check higher timeframes to confirm major trends
- Avoid trading sideways instruments unless using range strategies
Heatmap Gradient + RSI Triple Stochastic MT4 Scalping Strategy
This MT4 scalping strategy combines the Heatmap Gradient and Scale Forex Indicator (MT4) with the RSI Triple Stochastic Divergence Indicator (MT4).
The Heatmap shows the daily percentage change for each currency pair, allowing you to identify which pairs are moving the most today.
The RSI Triple Stochastic gives quick scalping triggers: a blue histogram above zero signals buys and a red histogram below zero signals sells.
Use the Heatmap to pick a strong pair and the histogram to time the entry on M1 or M5 charts.
Why this combo works
The Heatmap filters the market. It highlights pairs with clear momentum. Trading only those pairs raises the chance of a clean move.
The RSI Triple Stochastic times entries. The histogram shows short bursts of momentum that suit scalping. Combining both reduces noise and improves trade quality.
Timeframes and who should use this
This is a scalping method for M1 and M5 charts. It suits active traders and intraday scalpers. It is not for swing traders.
Trade major pairs with low spreads such as EURUSD, GBPUSD, and USDJPY.
Avoid exotics and avoid trading during major economic news.
Buy Entry Rules
- Heatmap: select a pair showing a clear positive daily percent change compared to other pairs.
- Chart: on M1 or M5, wait for the RSI Triple Stochastic histogram to turn blue and print above zero.
- Entry: buy at the close of the confirming candle once the blue bar appears.
- Stop loss: 6–10 pips on M1, 12–20 pips on M5, or just below the recent swing low.
- Take profit: 8–15 pips on M1, 15–30 pips on M5.
- Optionally, trail the stop after the trade moves in your favor by the stop amount.
- Position size: risk no more than 0.5–1% of account per trade.
Sell Entry Rules
- Heatmap: choose a pair showing a clear negative daily percent change relative to others.
- Chart: on M1 or M5, wait for the RSI Triple Stochastic histogram to turn red and print below zero.
- Entry: sell at the close of the confirming candle once the red bar appears.
- Stop loss: 6–10 pips on M1, 12–20 pips on M5, or just above the recent swing high.
- Take profit: 8–15 pips on M1, 15–30 pips on M5.
- Use a trailing stop after breakeven plus a few pips if you want to capture larger moves.
- Position size: keep risk small to survive periods of losses.
Advantages
- Quick filters. The Heatmap narrows the market to a few good pairs.
- Simple triggers. The histogram gives clear, repeatable entry signals.
- Works well in active sessions like London and New York.
- Easy to backtest and adjust for pair volatility.
Drawbacks
- Small targets mean spread and commission matter.
- Fast reversals during news can flip the histogram quickly.
- Requires attention. Not suitable for set-and-forget trading.
Case Study 1 — EURUSD, M1 long
In London open the Heatmap showed EURUSD among the top movers with +0.40% daily change.
On the M1 chart, the RSI Triple Stochastic histogram printed a blue bar above zero.
Entry: buy 1.09320 at candle close. Stop: 8 pips below entry at 1.09240. Take profit: 12 pips at 1.09440.
Outcome: price reached TP in eight minutes for a clean scalp.
Case Study 2 — GBPUSD, M5 short
New York session, the Heatmap showed GBPUSD down −0.30% on the day.
The M5 histogram turned red and formed a new red bar after a small rejection candle.
Entry: sell 1.27120 at candle close. Stop: 18 pips above entry at 1.27300. Take profit: scaled target at 24 pips at 1.26896.
Outcome: price moved down steadily. A trailing stop locked 16 pips before final exit.
Strategy Tips
- Trade session and spread: Only scalp during the active session for the pair. Skip trades if the spread is wide.
- Use clear HeatMap edges: Prefer pairs with a visible gap on the HeatMap. Small percentage differences may lead to weak moves.
- Skip noisy setups: Avoid trades if the histogram flips colors rapidly. Wait for a clean, single-color bar and candle close.
- Record and review: Keep a short log of entries, stop loss, take profit, and outcome. Review weekly to refine levels per pair.
Download Now
Download the “HeatMap-Gradient-Scale.mq4” indicator for Metatrader 4
FAQ
Can I customize the colors and layout?
Yes. All colors, gradients, and layout options are fully adjustable in the indicator settings.
Does it work on all currency pairs?
Yes. It monitors all instruments visible in the MT4 market watch window.
Which timeframe should I use?
The indicator works on all MT4 timeframes, but it is primarily used for daily trend analysis.
Can it be combined with other indicators?
Yes. Using it alongside trend-following or momentum tools improves trade selection and timing.
Summary
The HeatMap, Gradient, and Scale indicator for MT4 provides a clear visual overview of which instruments are trending and which are moving sideways.
It is fully customizable and allows traders to monitor multiple assets quickly.
By combining this tool with trend or momentum indicators, traders can identify strong opportunities, avoid sideways markets, and make informed trading decisions.


