The Ichimoku Forex Trend Monitor for Metatrader 4 displays the Ichimoku buy and sell trends for all time frames in a dashboard on the activity chart.
The indicator appears in the main MT4 chart and displays trend arrows for the M1, M5, M15, M30, H1, H4, D1, W1 and MN time frames.
Buy & Sell Trade Example
- Buy the currency pair whenever all arrows are colored green (strongly bullish).
- Sell the currency pair whenever all arrows are colored red (strongly bearish).
The Ichimoku Forex Trend Monitor indicator can be used for both entry and exit signals or mixed together with your own favorite trading strategy for improved performance.
The indicator works equally well on all assets (Forex, CFD stocks, Indices, Cryptocurrencies, Commodities,..) and shows promising results if used correctly.
Free Download
Download the “Ichimoku Trend Monitor.mq4” indicator for MT4
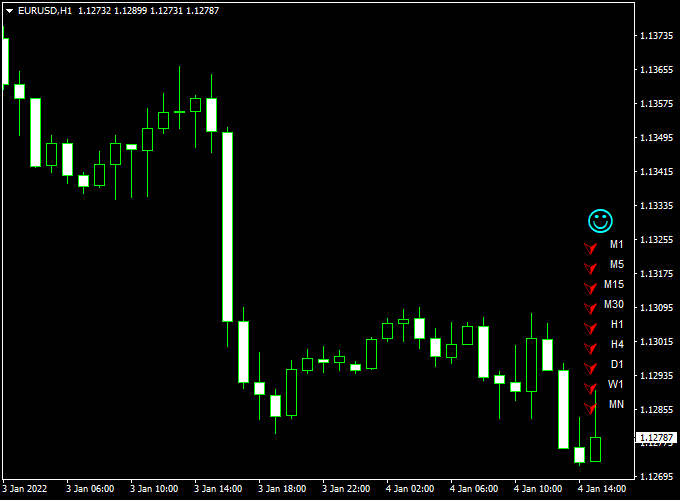
Indicator Chart (EUR/USD H1)
The example chart below displays the Ichimoku Forex Trend Monitor mt4 indicator in action on the trading chart.

Trading Tips:
Utilize your own favorite trade entry, stop loss and take profit method to trade with the Ichimoku Forex Trend Monitor indicator.
As always, trade in agreement with the overall trend and practice on a demo account first until you fully understand this indicator.
Please note that even the best trading indicator cannot yield a 100% win rate over long periods.
Indicator Specifications & Inputs:
Trading Platform: Developed for Metatrader 4 (MT4)
Currency pairs: Works for any pair
Time frames: Works for any time frame
Input Parameters: Variable (inputs tab), color settings & style
Indicator type: Trend
Repaint? No.
Ichimoku Trend Monitor + FQ Signals Bars MT4 Intraday Strategy
This intraday strategy combines the Ichimoku Forex Trend Monitor for MT4 with the FQ Signals Bars Forex Indicator for MT4.
The goal is to capture high-probability intraday trades by combining trend confirmation from the Ichimoku monitor with precise entry signals from the FQ Signals Bars.
This setup helps traders focus on the strongest moves while reducing false entries during choppy market conditions.
The Ichimoku Forex Trend Monitor shows small arrows in the right corner of the chart.
When all arrows are green, the trend is considered bullish. When all arrows turn red, the trend is bearish.
The FQ Signals Bars indicator displays blue arrows for buy signals and red arrows for sell signals.
Trades are taken only when both indicators align, improving the accuracy of intraday scalping and short-term trading.
This strategy works best on M5 and M15 charts and is ideal for currency pairs such as AUDUSD, NZDUSD, and USDCAD.
It is suitable for traders who prefer quick, visual entries with well-defined trend confirmation and risk management.
Buy Entry Rules
- Wait for the Ichimoku Trend Monitor arrows in the right corner to all turn green, indicating a strong bullish trend.
- Look for a blue buy arrow from the FQ Signals Bars indicator.
- Enter a buy trade at the open of the next candle after both conditions are met.
- Place a stop loss below the most recent swing low or the nearest support level.
- Set take profit at a 1.5 to 2 times risk-to-reward ratio or close when the Ichimoku arrows turn red.
Sell Entry Rules
- Wait for the Ichimoku Trend Monitor arrows in the right corner to all turn red, indicating a strong bearish trend.
- Look for a red sell arrow from the FQ Signals Bars indicator.
- Enter a sell trade at the open of the next candle after both conditions are met.
- Place a stop loss above the most recent swing high or the nearest resistance level.
- Set take profit at a 1.5 to 2 times risk-to-reward ratio or exit when the Ichimoku arrows turn green.
Advantages
- Combines trend confirmation and signal precision for higher probability trades.
- Visual signals are easy to read and act upon quickly.
- Works well on short intraday timeframes.
- Reduces false entries by requiring agreement between two indicators.
- Applicable across multiple currency pairs and trading sessions.
Drawbacks
- Less effective in low volatility or sideways markets.
- Signals can be late if the trend changes quickly.
- Requires manual monitoring for optimal exits.
- Scalping demands quick decision-making and attention.
- Stop loss and take profit levels must be carefully managed for consistent results.
Example Case Study 1
On the AUDUSD M5 chart, the Ichimoku Trend Monitor arrows all turned green during the London session.
A blue arrow appeared on the FQ Signals Bars indicator, triggering a buy trade at 0.6742.
The stop loss was set at 0.6735, and the take profit at 0.6755.
The trade captured 13 pips within 25 minutes before the Ichimoku arrows turned red, signaling an exit.
This shows how combining trend confirmation and precise entry signals improves scalping accuracy.
Example Case Study 2
On the NZDUSD M15 chart, the Ichimoku arrows turned red while the FQ Signals Bars displayed a red sell arrow.
A sell trade was entered at 0.6195 with a stop loss at 0.6205 and a take profit at 0.6182.
The price reached the target within 35 minutes, generating 13 pips.
This demonstrates the effectiveness of using trend alignment with signal arrows to capture fast intraday moves.
Strategy Tips
- Focus on M5 and M15 charts for fast intraday opportunities.
- Trade only when both the Ichimoku arrows and FQ Signals Bars align.
- Consider partial exits or trailing stops to secure profits in strong moves.
- Backtest the strategy on multiple pairs to optimize settings for each market.
Download Now
Download the “Ichimoku Trend Monitor.mq4” indicator for Metatrader 4


