The IMI is short for Intraday Momentum Index and as an oscillator its function is to display the ratio between the directed change in price and the total change in the prices over the designated period.
There are three adjustable input parameter on the Intraday Momentum Index MT5 indicator:
Period – defines the period deployed in the calculation:
Overbought – outlines the overbought level;
Oversold – outlines the oversold level.
The values on each of the input parameters can be adjusted to suit your individual trading peferences – so I’ll advice traders to get used to them.
Free Download
Download the “IMI.ex5” MT5 indicator
Example Chart
The formula that defines the IMI MT5 indicator is as follows:
Calculation:
IMI = 100*U /(U+D)
Where:
U = SMA(Up, Period),
D = SMA(Down, Period)
If Close > Open:
Up = Close – Open
Otherwise:
Up = 0
If Close < Open:
Down = Open – Close
Otherwise:
Down = 0
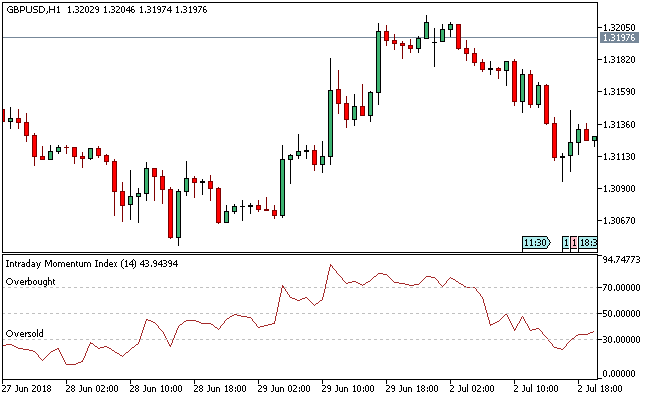
The indicator clearly outlines the area above the 70.00 level as overbought level and the one below the 30.00 level as oversold.
If the brown line of the Intraday Momentum Index custom Metatrader 5 indicator break and stay above the 70.00 level, price is said to be bullish, while if the brown line of the Intraday Momentum Index break and stay below the 30.00 level, price is said to be bearish.
Download
Download the “IMI.ex5” Metatrader 5 indicator
MT5 Indicator Characteristics
Currency pairs: Any
Platform: Metatrader 5
Type: chart window indicator
Customization options: Variable (Period, Overbought, Oversold), Colors, width & Style.
Time frames: 1-Minute, 5-Minutes, 15-Minutes, 30-Minutes, 1-Hour, 4-Hours, 1-Day, 1-Week, 1-Month
Type: oscillator
Installation
Copy and paste the IMI.ex5 indicator into the MQL5 indicators folder of the Metatrader 5 trading platform.
You can access this folder from the top menu as follows:
File > Open Data Folder > MQL5 > Indicators (paste here)


