
About the JJN Big Trend Forex Indicator
The JJN Big Trend Forex Indicator for MT4 is a trend-detection tool that simplifies trading decisions.
It displays trend direction for multiple currency pairs in a compact dashboard, helping traders spot market direction at a glance.
The dashboard shows colored dots representing trend strength: green for bullish, red for bearish, and yellow for neutral or weak trends.
Traders can use this information to enter trades in the direction of the market or filter other strategies for higher accuracy.
This indicator works on all currency pairs and timeframes, making it suitable for beginners and experienced traders who want a quick and clear overview of market trends.
Free Download
Download the “JJN-BigTrend.mq4” indicator for MT4
Key Features
- Mini dashboard shows trend direction for multiple currency pairs
- Green dots indicate a bullish trend, red dots bearish, and yellow for neutral
- Can be used as a primary trade entry tool or trend filter
- Helps traders spot strong trends and avoid weak markets
Indicator Chart
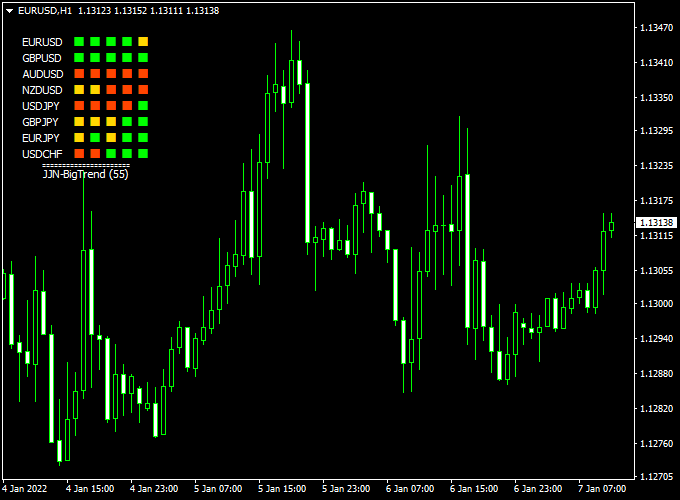
The chart shows the JJN Big Trend Indicator applied to an MT4 price chart.
The mini dashboard displays colored dots for each monitored pair.
Green dots suggest buying opportunities, red dots suggest selling, and yellow dots indicate neutral trends.
Guide to Trade with the JJN Big Trend Indicator
Buy Rules
- Open a buy trade when at least 4 out of 5 dashboard dots are red
- Avoid buying during neutral periods indicated by yellow dots
Sell Rules
- Open a sell trade when at least 4 out of 5 dashboard dots are green
- Avoid selling during neutral periods indicated by yellow dots
Stop Loss
- Place a stop loss below the nearest swing low for buy trades
- Place a stop loss above the nearest swing high for sell trades
- Adjust according to volatility and session activity
Take Profit
- Target previous swing highs for buy trades
- Target previous swing lows for sell trades
- Consider partial exits when the dashboard starts showing neutral or opposite dots
Practical Tips
- Use the dashboard as a trend filter to confirm other strategies
- Combine with price action or breakout indicators for higher accuracy
- Focus on pairs showing strong trend signals (mostly green or red dots)
- Check higher timeframes to avoid trading against the overall market direction
JJN Big Trend + Daily Support & Resistance Breakout MT4 Strategy
This breakout strategy combines the JJN Big Trend Forex Indicator for MT4 and the Daily Support & Resistance Breakout Indicator for MT4.
The JJN Big Trend indicator displays a mini dashboard in the upper left corner with green dots for bullish trends and red dots for bearish trends.
A trend is confirmed when at least 4 green or red dots appear.
The Daily Support & Resistance indicator shows horizontal lines marking key daily price levels.
Combining these two allows traders to enter breakouts in the direction of the confirmed trend, reducing false entries and improving breakout accuracy.
This strategy is suitable for intraday trading on M15 and H1 charts and works best on major currency pairs like EURUSD, GBPUSD, and USDJPY.
It is ideal for traders who want to catch strong intraday moves following key levels.
Buy Entry Rules
- Wait for the JJN Big Trend dashboard to show at least 4 green dots, confirming a bullish trend.
- Identify the nearest daily resistance line above the current price using the Daily Support & Resistance indicator.
- Enter a buy trade when the price breaks and closes above that resistance line.
- Stop Loss: place below the most recent daily support line or a few pips below the breakout candle low.
- Take Profit: aim for the next resistance level, or use a 2:1 reward-to-risk ratio.
- You may also trail stops if momentum is strong.
Sell Entry Rules
- Wait for the JJN Big Trend dashboard to show at least 4 red dots, confirming a bearish trend.
- Locate the nearest daily support line below the current price.
- Enter a sell trade when the price breaks and closes below that support line.
- Stop Loss: place above the most recent resistance line or a few pips above the breakout candle high.
- Take Profit: aim for the next support level or a 2:1 reward-to-risk ratio.
- Use trailing stops if the price continues in the trend direction.
Advantages
- Combines trend confirmation with key support and resistance levels to improve breakout accuracy.
- Provides clear visual signals via the dashboard and chart lines.
- Reduces false breakouts by waiting for trend confirmation.
- Works on multiple pairs and timeframes for intraday trading.
Drawbacks
- Breakouts can fail in choppy markets or during low liquidity periods.
- Requires patience to wait for trend confirmation and breakout alignment.
- Stop losses may need to be adjusted for volatile pairs.
- Not suitable for scalping; better for intraday swing trades.
Example Case Study 1 — EURUSD, M15
During the London session, the JJN Big Trend dashboard showed 4 green dots, confirming a bullish trend.
The Daily Support & Resistance indicator identified resistance at 1.0860. Price broke above this level and closed above it.
A buy trade was entered at 1.0862 with a stop at 1.0845 and a take profit at 1.0895.
Price surged, hitting the target and producing +33 pips within 90 minutes.
Example Case Study 2 — GBPUSD, H1
The JJN Big Trend indicator displayed 4 red dots, confirming a bearish trend.
Daily support was located at 1.2650. Price broke below this level and closed under it.
A sell entry at 1.2648 was executed with a stop loss at 1.2665 and a target at the next support level, 1.2600.
Price followed the trend and reached the take profit within a few hours, resulting in +48 pips.
Strategy Tips
- Focus on breakout trades in the direction of confirmed trends for higher probability setups.
- Avoid trading near major news releases that may cause false breakouts.
- Use multiple timeframes to confirm trend and breakout alignment.
- Consider trailing stops for strong trending moves to capture more profit.
- Test the strategy on demo accounts first to find optimal stop-loss distances per pair.
Download Now
Download the “JJN-BigTrend.mq4” indicator for Metatrader 4
FAQ
How do I interpret the dashboard dots?
Green dots indicate a strong uptrend, red dots a strong downtrend, and yellow dots a weak or neutral trend. Focus on trades when most dots align in one color.
Can this indicator track multiple pairs at once?
Yes. The dashboard displays trends for several currency pairs simultaneously, allowing quick comparison and better trade selection.
Is it suitable for scalping or long-term trades?
It works for all trading styles. Scalpers can use shorter timeframes, while swing traders can monitor higher timeframes for trend direction.
Do I need other indicators to use this?
The indicator can be used alone, but combining it with price action, support/resistance, or breakout signals improves trade accuracy.
Summary
The JJN Big Trend Forex Indicator for MT4 is a versatile tool that provides a quick overview of market trends for multiple currency pairs.
The color-coded dashboard makes it easy to spot bullish, bearish, or neutral market conditions.
It works on all timeframes and pairs, helping traders identify strong trends and avoid uncertain markets.
The indicator can be used as a primary trend guide or as a filter for other strategies, offering flexibility for both beginners and experienced traders.
Overall, the JJN Big Trend Indicator simplifies trend analysis, improves trade decision-making, and allows traders to focus on high-probability opportunities without overcomplicating their charts.


