The Laguerre ADX indicator for Metatrader 5 provides cloud-based trend trading signals suitable for any currency pair and time frame.
The indicator is composed of the Laguerre oscillator and the ADX trend indicator.
ADX stands for Average Directional Index.
It appears in a separate chart window as a series of non-repainting blue and magenta colored clouds.
The trading logic of the indicator is as follows::
- A blue Laguerre ADX cloud indicates an uptrend.
- A magenta Laguerre ADX cloud signifies a downtrend.
- The indicator generates alternating buy and sell signals.
The following indicator variables and values can be modified: ADX period, gamme, colors.
Before applying the Laguerre ADX indicator to live trading, it is crucial to thoroughly understand its functionality and conduct extensive testing on a demo account.
Download Indicator 🆓
Laguerre_ADX.mq5 Indicator (MT5)
Chart Example
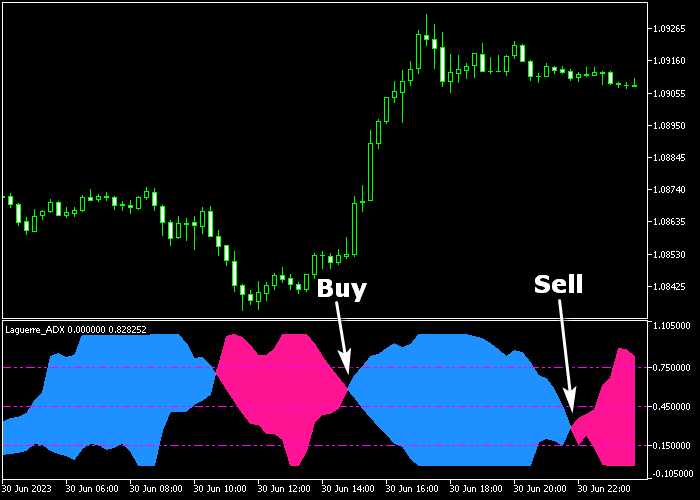
The picture below shows how the Laguerre ADX Forex indicator looks like when applied to the MT5 chart.

How To Buy And Sell Forex Pairs Utilizing The Laguerre ADX Indicator?
Find a simple trading strategy below:
Buy Signal
- The blue colored cloud generates a buy signal.
- Initiate a buy transaction and place your stop loss below the most recent swing low region.
- Exit the buy trade for a reward/risk ratio of at least 1.5, or wait for a bearish cloud signal.
Sell Signal
- The magenta colored cloud generates a sell signal.
- Initiate a sell transaction and place your stop loss above the most recent swing high zone.
- Exit the sell trade for a reward/risk ratio of at least 1.5, or wait for a bullish cloud signal.
Download Now 🆓
Laguerre_ADX.mq5 Indicator (MT5)
Frequently Asked Questions
How Do I Install This Custom Indicator On Metatrader 5?
- Open the MT5 trading platform
- Click on the File menu button located at the top left part of the platform
- Click on Open Data Folder > MQL5 folder > Indicators
- Copy the Laguerre_ADX.mq5 indicator file in the Indicators folder
- Close and restart the trading platform
- You will find the indicator here (Navigator window > Indicators)
- Drag the indicator to the chart to get started with it!
How Do I Edit This Indicator?
- Click in the open chart with your right mouse button
- In the dropdown menu, click on Indicator List
- Select the indicator and click on properties
- Now you can edit the inputs, colors, levels, scale and visualization
- Finally click the OK button to save the new configuration


