
About the Low High Price Indicator
The Low High Price indicator for MT4 serves as an automated mapping tool for significant market levels across multiple timeframes.
It identifies the highest and lowest price points for the H1, H4, daily, and weekly periods, projecting them directly onto your active chart.
This tool removes the need for manual analysis by pinpointing where major institutional orders likely reside.
By consolidating these key benchmarks, it provides a clear view of where price is likely to react or reverse.
It is an essential utility for traders who rely on price action and horizontal support and resistance zones to time their entries.
Free Download
Download the “PreviousCandleHiLo.mq4” MT4 indicator
Key Features
- Displays high and low prices for H1, H4, D1, and W1 timeframes simultaneously.
- Eliminates the need to switch between different chart windows for level identification.
- Automatically updates levels as new price extremes are established in real time.
- Identifies psychological support and resistance zones based on historical peaks and troughs.
- Assists in setting accurate price targets and stop loss placements for any pair.
Indicator Chart
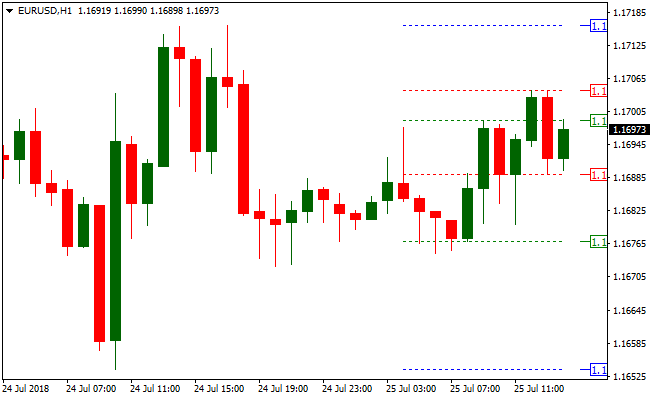
The chart features the Low High Price indicator marking historical extremes with horizontal labels.
It shows the current price interacting with the previous daily high and weekly low.
These lines highlight the most significant boundaries for the current trading session, indicating where momentum might stall or accelerate.
Guide to Trade with the Low High Price Indicator
Buy Rules
- Observe the price approaching a major low level from a higher timeframe like D1 or W1.
- Wait for a bullish rejection candle to form at this historical support zone.
- Enter a buy order once the price holds above the identified timeframe low.
- Confirm the entry with a secondary momentum oscillator moving upward.
Sell Rules
- Observe the price approaching a major high level from a higher timeframe like D1 or W1.
- Wait for a bearish rejection candle to form at this historical resistance zone.
- Enter a sell order once the price fails to break above the identified timeframe high.
- Confirm the entry with a secondary momentum oscillator moving downward.
Stop Loss
- Place the stop loss a few pips below the support level for buy trades.
- Place the stop loss a few pips above the resistance level for sell trades.
- Ensure the stop is wide enough to avoid minor liquidity spikes around the levels.
Take Profit
- Target the nearest high level from the H4 or D1 timeframe for buy trades.
- Target the nearest low level from the H4 or D1 timeframe for sell trades.
- Close the position if the price shows signs of exhaustion before reaching the level.
Low High Price and CCI MTF Signals Forex Swing Trading Strategy MT4
This MT4 swing trading strategy combines the information from the Low High Price H1 H4 D1 W1 Indicator with the entry cues of the CCI MTF Signals Indicator.
The Low High Price indicator shows you the recent key price extremes across multiple timeframes — hourly, four‑hour, daily, and weekly.
These levels often act as support and resistance zones where price reversals or continuations occur.
The CCI MTF Signals indicator prints blue arrows for buy entries and red arrows for sell entries, providing clear timing for market entry within the context of these key zones.
This strategy is built for swing traders looking to capture meaningful moves over a few hours up to a few days.
It works best on pairs that respect support and resistance levels and exhibit clear swings, such as EURUSD, AUDNZD, GBPCHF, and USDCHF.
By combining multi‑timeframe context with precise signal timing, you improve the accuracy of entries and exits.
Buy Entry Rules
- Identify a bullish bias: price should be approaching or bouncing off a key low from H4, D1, or W1 levels marked by the Low High Price indicator.
- Confirm that the most recent swing low aligns with one of these multi‑timeframe lows, suggesting strong support.
- A blue arrow appears from the CCI MTF Signals indicator, signaling a buy entry.
- Enter long at the close of the candle where the blue arrow appears.
- Place a stop loss below the recent swing low or just below the H4 daily low for added protection.
- Exit when price approaches the next multi timeframe high level or if a red CCI arrow appears signaling a trend exhaustion.
Sell Entry Rules
- Identify a bearish bias: price should be approaching or reversing from a key high marked by the Low High Price indicator on H4, D1, or W1 levels.
- Confirm that the most recent swing high coincides with one of these multi‑timeframe highs, suggesting strong resistance.
- A red arrow appears from the CCI MTF Signals indicator, signaling a sell entry.
- Enter short at the close of the candle where the red arrow appears.
- Place a stop loss above the recent swing high or just above the H4 daily high to control risk.
- Exit when price nears the next multi timeframe low level or if a blue CCI arrow appears signaling trend exhaustion.
Advantages
- Combines key price extremes from multiple timeframes with precise entry signals for clearer trade decisions.
- Supports swing trading by focusing on meaningful moves between major support and resistance levels.
- Flexible exit options allow you to lock in profits near logical price barriers or when momentum shifts.
Drawbacks
- During sideways markets, price may repeatedly test highs and lows without giving a clean breakout or CCI confirmation.
- CCI arrow signals can occur near key levels before full reversal, leading to early entries that require patience and management.
Case Study 1
On EURUSD H4 during a European session, price approached the daily low marked by the Low High Price indicator after a pullback from a recent swing high.
The CCI MTF Signals indicator then printed a blue arrow right at support.
A long trade was entered at the close of that candle.
Price gradually climbed toward the next H4 high, resulting in a 87 pip gain before slowing near that resistance.
No stop loss was hit below the swing low as support held well.
Case Study 2
On AUDNZD D1, price rallied to test the weekly high indicated by the Low High Price indicator.
The CCI MTF Signals indicator printed a red arrow right at the resistance zone.
A sell trade was taken on the close of the red arrow candle.
Price then fell steadily for about 102 pips before hitting the next multi timeframe low region where profit was taken.
The stop above the swing high remained untouched as the bearish wave developed.
Strategy Tips
- Give preference to signals that occur near key multi timeframe highs or lows instead of random mid‑range signals.
- Avoid entering trades immediately after major economic news releases to reduce the chance of false breakouts around key levels.
- If price briefly breaks a key level and then returns, wait for a confirming CCI arrow before considering entry.
- Consider adjusting your stop loss to a break even point once price moves favorably by half your target distance.
Download Now
Download the “PreviousCandleHiLo.mq4” Metatrader 4 indicator
FAQ
Why are these specific timeframes included?
H1, H4, D1, and W1 represent the primary levels used by institutional and bank traders.
Tracking these extremes allows you to trade from the same zones as the largest market participants.
Is this indicator useful for breakout trading?
Extremely. A clean break and close above a weekly high or below a weekly low often signals the start of a massive trend extension, making it a favorite for breakout specialists.
Summary
The Low High Price indicator is a vital tool for simplifying multi-timeframe analysis.
Automating the identification of support and resistance allows for more objective and disciplined trading decisions.
It is a robust utility that significantly improves the accuracy of any price action strategy.
Combining these levels with candlestick confirmation provides a high-probability approach to navigating various market conditions.


