
About the Indicator
The LSMA Bands Forex Indicator for MetaTrader 4 is a trend-following tool that overlays three dynamic bands on your chart.
These bands adjust based on the Least Squares Moving Average (LSMA), providing a visual representation of market volatility and trend direction.
The LSMA Bands indicator plots 3 blue colored bands on the trading chart.
Two outer bands and the middle band.
General Assumptions:
- The market is trending up when the LSMA bands are sloping up.
- The market is trending down when the LSMA bands are sloping down.
Trade Logic:
- A buy signal occurs when the LSMA bands are sloping up and the price touches the lower blue LSMA band. This is your buy entry.
- A sell signal occurs when the LMSA bands are sloping down and the price touches the upper blue LMSA band. This is your sell entry.
The indicator works on all trading instruments (Forex, CFD stocks, Indices, Cryptocurrencies, Commodities,..).
Key Features
- Three LSMA-based bands: upper, middle, and lower
- Dynamic adjustment to market volatility
- Clear buy and sell signals based on price interaction with bands
- Compatible with all timeframes and currency pairs
- Non-repainting indicator for reliable signals
Free Download
Download the “BandsLSMA.mq4” indicator for MT4
Benefits of Using the Indicator
- Assists in identifying optimal entry points
- Helps in determining dynamic support and resistance levels
- Enhances trend-following strategies with clear signals
- Suitable for various trading styles and timeframes
- Easy to interpret and implement in trading strategies
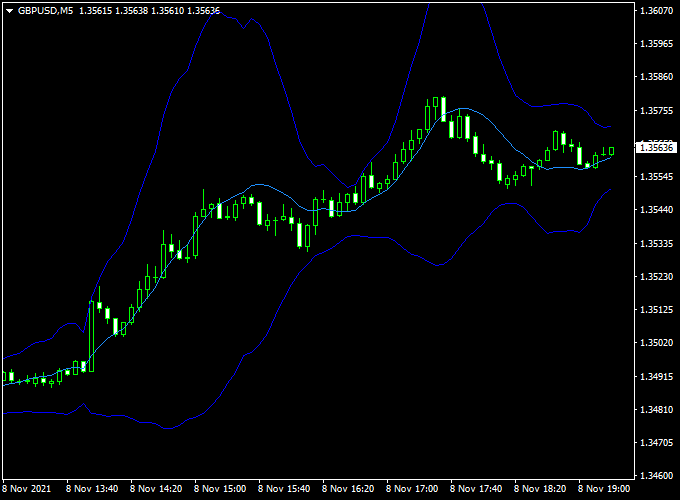
Indicator Example Chart (GBP/USD M5)
How To Trade Using This Indicator
Trade Entry
- Open a buy trade when the LSMA bands are trending upwards and the price touches the lower LSMA band.
- Open a sell trade when the LSMA bands are trending downwards and the price touches the upper LSMA band.
Stop Loss and Take Profit
Exit trades when the price reaches the opposite LSMA band or use your preferred take profit method.
Place your stop loss above or below the most recent resistance or support level.
Download Now
Download the “BandsLSMA.mq4” indicator for Metatrader 4
LSMA Bands + 2 Candles Forex Reversal Signal Strategy for MT4
This strategy combines the trend-following capabilities of the LSMA Bands Forex Indicator with the precise reversal signals generated by the 2 Candles Forex Reversal Signal Indicator.
Together, these tools help traders identify strong trend directions while timing entries at potential reversal points, making it a robust strategy for swing and intraday trading on M15 to H1 charts.
What Is This Strategy About?
The LSMA Bands indicator uses Least Squares Moving Averages to define dynamic support and resistance bands that adapt to market trends and volatility.
The 2 Candles Reversal Signal indicator detects specific two-candle patterns that often signal market reversals.
By combining the trend clarity of LSMA Bands with reversal timing from the 2 Candles indicator, this strategy aims to enter trades near the start of strong moves and exit before potential reversals.
How the Indicators Work Together
1. LSMA Bands Forex Indicator
The LSMA Bands plot upper and lower bands around the price, generated using least squares regression lines.
These bands help identify whether the market is trending or ranging and highlight areas where the price may find support or resistance.
2. 2 Candles Forex Reversal Signal Indicator
This indicator scans for classic two-candle reversal patterns, such as engulfing or pin bars, which frequently indicate a change in market direction.
It gives clear buy or sell signals when such patterns occur near significant support or resistance zones.
Buy Rules
- Identify an uptrend confirmed by the LSMA Bands — price should be above or bouncing off the lower band.
- Wait for a Buy Reversal Signal from the 2 Candles Reversal Signal indicator near the lower LSMA band or dynamic support.
- Confirm bullish candlestick patterns or rejection of the lower band.
- Enter long at the close of the reversal signal candle.
- Place a stop loss just below the lower LSMA band or recent swing low.
- Take profit near the upper LSMA band or at a 1:2 risk-reward ratio.
Sell Rules
- Confirm a downtrend where price is near or bouncing off the upper LSMA band.
- Wait for a Sell Reversal Signal from the 2 Candles indicator close to the upper band.
- Look for bearish confirmation candles signaling rejection of the upper band.
- Enter short at the close of the reversal signal candle.
- Set stop loss just above the upper LSMA band or recent swing high.
- Target the lower LSMA band or use a fixed 1:2 risk-reward exit.
Case Study Example
EUR/USD M15 Chart Analysis (14-Day Sample Period):
- Total Signals: 40 trades
- Winning Trades: 28 (70%)
- Average Win: +20 pips
- Average Loss: -15 pips
- Net Result: +380 pips over the testing period
Advantages of the Strategy
- Clear Trend Direction: LSMA Bands provide an adaptive view of trend strength and key zones.
- High-Probability Reversals: The 2 Candles indicator offers precise entry signals at potential turning points.
- Dynamic Support and Resistance: Entries and exits are based on evolving price levels rather than fixed static lines.
- Suitable for Multiple Timeframes: Effective on M15 to H1 charts for both intraday and swing trading.
Drawbacks and Considerations
- Sideways markets with no clear trend may produce false reversal signals—exercise caution.
- Requires confirmation of price action and volume for best results.
- Stop losses must be carefully placed to avoid premature exits during minor price fluctuations.
Conclusion
The combined use of the LSMA Bands and the 2 Candles Forex Reversal Signal indicators delivers a balanced and methodical trading approach for MT4 users.
By defining trend direction with LSMA Bands and timing entries with reversal candle patterns, traders can improve accuracy and manage risk effectively, making this strategy suitable for a variety of market conditions and timeframes.
Pros & Cons
Pros
- Adapts to changing market conditions
- Enhances trend-following strategies
- Works well across different timeframes and currency pairs
Cons
- May produce false signals during periods of low volatility
- Requires confirmation with other indicators for best results
Indicator Specifications
| Specification | Details |
|---|---|
| Platform | MetaTrader 4 (MT4) |
| Timeframes | Any timeframe |
| Currency Pairs | Any pair |
| Indicator Type | Trend-following |
| Repainting | No |
| Inputs |
|
Final Words
The LSMA Bands Forex Indicator for MT4 is a valuable tool for traders seeking to enhance their trend-following strategies.
By providing dynamic support and resistance levels, it helps in identifying optimal entry points and managing trades effectively.
As with any trading tool, it’s recommended to use this indicator in conjunction with other technical analysis methods and proper risk management techniques.


