About the MACD Color Indicator
The MACD Color indicator for MT4 is an enhanced version of the traditional MACD oscillator that uses color to highlight trend direction.
It displays green and red histogram bars in a separate window below your main chart.
Green bars suggest bullish momentum, while red bars indicate bearish momentum.
Like other oscillator indicators, the MACD Color works best when combined with a trend-following tool, such as a simple moving average (SMA), exponential moving average (EMA), or Parabolic SAR.
The default MACD settings are Fast EMA 12, Slow EMA 26, and Signal EMA 9, but these can be adjusted through the input menu to fit your trading style.
This flexibility allows traders to fine-tune the indicator for different currency pairs, timeframes, or market conditions.
Free Download
Download the “macd-color-indicator.mq4” MT4 indicator
Key Features
- Colored histogram bars for quick identification of bullish and bearish momentum.
- Displays trends clearly in a separate MT4 window.
- Flexible settings: adjust Fast EMA, Slow EMA, and Signal EMA as needed.
- Works well with trend-following indicators for higher probability trades.
- Helps identify trend reversals and continuation signals quickly.
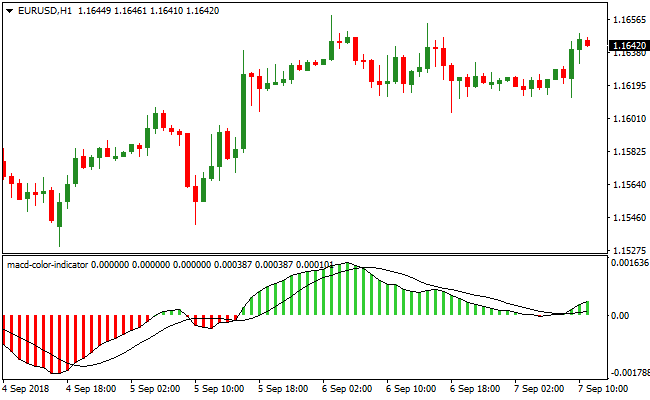
Indicator Chart
The MACD Color indicator shows green bars for bullish trends and red bars for bearish trends below the price chart.
Traders can easily see the momentum direction and spot potential trade entries.
Combined with a trend indicator, the chart provides clear visual guidance for buy and sell decisions.

Guide to Trade with MACD Color Indicator
Buy Rules
- Open a buy trade when a green MACD histogram bar appears.
- Confirm the trend is bullish using a moving average or other trend-following tool.
- Check that the signal is not near a major resistance level.
- Avoid buying if the histogram remains red or shows weakening green bars.
Sell Rules
- Open a sell trade when a red MACD histogram bar appears.
- Confirm the trend is bearish with a trend-following indicator.
- Check that the signal is not near a major support level.
- Avoid selling if the histogram remains green or shows weakening red bars.
Stop Loss
- Set stop loss just beyond the most recent swing point opposite to your trade direction.
- For buy trades, place it slightly below the last swing low or consolidation zone.
- For sell trades, place it slightly above the last swing high or consolidation zone.
- Optionally, widen the stop slightly during high volatility periods to avoid early exits.
Take Profit
- Close trades when the histogram changes color, signaling a potential trend reversal.
- Target the next support or resistance level for partial or full exit.
- Trail the stop along a moving average or trend line to capture extended moves.
- Adjust targets based on timeframe and volatility for realistic profits.
MACD Color Indicator + Free Forex Scalping Indicator for M1 & M5
This MT4 scalping strategy combines the MACD Color Indicator and the Free Forex Scalping Indicator to capture fast, intraday price moves.
The MACD Color Indicator shows green histograms above zero for bullish trends and red histograms below zero for bearish trends.
The Free Forex Scalping Indicator provides clear entry signals with green bars for buy trades and red bars for sell trades.
Using both indicators together allows traders to enter trades in the direction of the trend while following momentum signals for fast scalp opportunities.
This strategy works best on M1 and M5 charts for rapid scalping sessions.
It is ideal for traders looking for quick trades during high liquidity periods with well-defined trend alignment and entry signals.
Buy Entry Rules
- The MACD Color indicator shows a green histogram above zero, confirming a bullish trend.
- The Free Forex Scalping Indicator displays green bars, signaling a buy opportunity.
- Enter the trade immediately after both conditions are met.
- Place a stop loss below the recent swing low or support level.
- Take profit when the Free Forex Scalping Indicator turns red or the MACD histogram turns red, typically targeting 4-7 pips on M1 and 6-10 pips on M5 charts.
Sell Entry Rules
- The MACD Color indicator shows a red histogram below zero, confirming a bearish trend.
- The Free Forex Scalping Indicator displays red bars, signaling a sell opportunity.
- Enter the trade immediately after both conditions are met.
- Place a stop loss above the recent swing high or resistance level.
- Take profit when the Free Forex Scalping Indicator turns green or the MACD histogram turns green, typically targeting 4-7 pips on M1 and 6-10 pips on M5 charts.
Advantages
- Combines trend confirmation with precise entry signals for high-probability scalp trades.
- Effective for lower timeframes, providing multiple intraday trading opportunities.
- Helps avoid counter-trend entries by requiring alignment between the MACD trend and scalp signals.
- Works well across major and minor currency pairs during active sessions.
Drawbacks
- Requires rapid execution and focus due to fast M1-M5 price movements.
- Scalping can be stressful for traders who cannot monitor charts continuously.
Case Study 1: EURUSD M1
During the London session, EURUSD showed a green MACD histogram above zero and the Free Forex Scalping Indicator displayed green bars.
A buy trade was executed with a stop below the recent swing low.
Price moved upward quickly and the trade was closed when the scalp indicator turned red, capturing 5 pips.
Aligning trend and scalp signals allowed a high-probability intraday scalp.
Case Study 2: GBPJPY M5
GBPJPY displayed a red MACD histogram below zero and the Free Forex Scalping Indicator showed red bars during the New York session.
A sell trade was entered with a stop above the recent swing high.
Price moved downward steadily and the trade was closed when the scalp indicator turned green, securing 8 pips.
Combining both indicators ensured a reliable short-term trend-aligned scalp.
Strategy Tips
- Focus on major pairs during high liquidity sessions for more consistent scalp opportunities.
- Only take trades when both the MACD trend and scalp signal align to avoid false entries.
- Use small pip targets to match the fast M1 and M5 timeframes.
- Place stop losses at logical swing points to manage risk effectively.
- Limit active trades to 1-3 currency pairs at a time to maintain focus and prevent mistakes.
- Monitor the histogram and scalp bars closely for early exit signals to lock in profits quickly.
Download Now
Download the “macd-color-indicator.mq4” Metatrader 4 indicator
FAQ
How do the colored bars work?
Green bars indicate bullish momentum, and red bars indicate bearish momentum.
The colors make it easier to visualize trend direction compared to standard MACD histograms.
Can I adjust the MACD settings?
Yes. You can modify the Fast EMA, Slow EMA, and Signal EMA in the input menu to fit your preferred timeframe or trading style.
Do I need other indicators for confirmation?
While the colored MACD provides trend signals on its own, combining it with moving averages, trend lines, or Parabolic SAR increases accuracy and reduces false signals.
Summary
The MACD Color indicator for MT4 simplifies trend trading by highlighting bullish and bearish momentum with colored histogram bars.
When paired with a trend-following tool, it helps traders confirm entries, exit trades, and spot potential reversals quickly.
Fully customizable and suitable for any timeframe or currency pair, it is a practical tool for both beginners and experienced traders.


