
About the Momentum Histogram Indicator
The Momentum Histogram indicator for MT4 is a short-term momentum tool that helps traders identify buy and sell opportunities based on price movement.
It plots a histogram below the main chart, oscillating above and below the zero line to represent bullish and bearish momentum.
Bars above the zero line indicate bullish momentum, while bars below indicate bearish pressure.
This makes it easy to spot potential entries in the direction of short-term trends.
Traders can use it as a leading indicator to anticipate momentum shifts or as a trend-following tool to stay aligned with the dominant price direction.
It is particularly effective when combined with a longer-term moving average to ensure trades follow the overall trend.
By translating price momentum into a simple histogram, the Momentum Histogram indicator allows traders to focus on high-probability setups while managing risk efficiently.
Free Download
Download the “Momentum_Histo.mq4” MT4 indicator
Key Features
- Displays bullish and bearish momentum in a histogram format.
- Oscillates above and below a zero line to indicate trend direction.
- Can be combined with trend filters for improved trade accuracy.
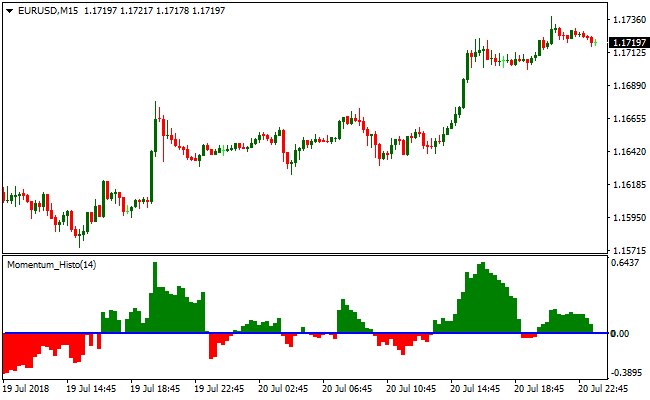
Indicator Chart
The Momentum Histogram indicator appears beneath the main price area as a histogram of green and red bars.
Bars above zero highlight bullish momentum, while bars below zero highlight bearish momentum.
Traders can quickly identify short-term trends and potential buy and sell opportunities in the market.
Guide to Trade with the Momentum Histogram Indicator
Buy Rules
- Wait for histogram bars to appear above the zero line.
- Confirm the overall trend is upward using a longer-term moving average.
- Open a buy trade when bullish momentum strengthens.
- Avoid trades against the dominant downtrend.
Sell Rules
- Wait for histogram bars to appear below the zero line.
- Confirm the overall trend is downward using a longer-term moving average.
- Open a sell trade when bearish momentum strengthens.
- Avoid trades against the dominant uptrend.
Stop Loss
- Place the stop below a recent support zone for buy trades.
- Place the stop above a recent resistance zone for sell trades.
- Adjust the stop if volatility expands unexpectedly.
- Close trades early if histogram momentum reverses prematurely.
Take Profit
- Close buy trades when histogram bars weaken or move back toward zero.
- Close sell trades when histogram bars lose bearish momentum.
- Take partial profits near prior highs or lows.
- Exit fully if the opposite trend signal forms.
Momentum Histogram and SuperTrend MT4 Scalping Strategy
This MT4 scalping strategy combines the Momentum Histogram indicator with the SuperTrend MTF indicator to catch quick, high probability trades on short timeframes.
The Momentum Histogram provides real-time momentum direction with a green histogram signaling bullish strength and a red histogram indicating bearish pressure.
The SuperTrend MTF confirms the trend with a green line for bullish trends and a red line for bearish trends.
Combining these indicators allows scalpers to enter trades in the direction of strong momentum while minimizing false entries.
This strategy is best used on M1, M5, and M15 charts, making it suitable for intraday scalpers.
It works well on highly liquid currency pairs such as EURJPY, GBPUSD, and AUDUSD, where price reacts quickly and frequently within short periods.
The approach focuses on capturing small but consistent pip gains by aligning momentum with the overall trend.
Buy Entry Rules
- Wait for the SuperTrend MTF line to turn green, indicating a bullish trend.
- Confirm that the Momentum Histogram is trading above the zero line (green histogram).
- Enter a buy trade at the close of the candle where both conditions align.
- Place the stop loss just below the most recent swing low or the SuperTrend line.
- Take profit when the Momentum Histogram turns red or when the SuperTrend line flips to red.
Sell Entry Rules
- Wait for the SuperTrend MTF line to turn red, indicating a bearish trend.
- Confirm that the Momentum Histogram is trading below the zero line (red histogram).
- Enter a sell trade at the close of the candle where both conditions align.
- Place the stop loss just above the most recent swing high or the SuperTrend line.
- Take profit when the Momentum Histogram turns green or when the SuperTrend line flips to green.
Advantages
- Fast and simple scalping signals with clear trading signals.
- Combines trend direction and momentum for higher probability trades.
- Effective on short timeframes for quick trade execution.
- Stop loss placement is logical and based on market swings or indicator levels.
- Helps traders avoid entering against the main momentum.
Drawbacks
- Scalping profits are generally small, requiring multiple successful trades to accumulate gains.
- Traders need to react quickly, which may be stressful for beginners.
- Requires tight spreads and low commissions to remain profitable due to small pip targets.
Example Case Study 1
On the M5 EURJPY chart, the SuperTrend line turned green and the Momentum Histogram was above zero.
A buy trade was entered at candle close, with the stop loss placed below the recent swing low.
Price moved higher quickly, and the trade was closed when the Momentum Histogram turned red.
This scalping trade captured 22 pips during the short upward momentum.
Example Case Study 2
On the M1 GBPUSD chart, the SuperTrend line flipped red and the Momentum Histogram dropped below zero.
A sell trade was entered at the close of the confirming candle, with the stop loss above the recent swing high.
Price moved lower within minutes, and the trade was closed when the SuperTrend line turned green.
This trade captured 15 pips, demonstrating how the strategy can be used for rapid scalping on liquid pairs.
Strategy Tips
- Focus on highly liquid pairs to ensure smooth price movement and tight spreads.
- Use the strategy during active market sessions such as London and New York for better scalping opportunities.
- Wait for both the SuperTrend line and Momentum Histogram to confirm the move before entering.
- Keep position sizes small relative to account equity to manage risk on multiple quick trades.
- Exit trades promptly when momentum shifts to preserve gains and avoid reversals.
- Combine with key support and resistance levels to improve entry quality.
Download Now
Download the “Momentum_Histo.mq4” Metatrader 4 indicator
FAQ
How do I interpret changes in histogram height?
Increasing bar height above zero indicates strengthening bullish momentum, while taller bars below zero show stronger bearish pressure. Shrinking bars suggest momentum is fading.
Can the Momentum Histogram be combined with other indicators?
Yes. Pairing it with moving averages or trend indicators helps confirm the dominant trend and filter out false signals for more reliable trades.
How can I use it for swing trading?
Use the histogram on higher timeframes to follow the trend. Enter trades when bars confirm momentum in line with the trend and exit when bars show weakening pressure.
Summary
The Momentum Histogram indicator provides a practical way to track short-term market momentum using a simple histogram display.
It helps traders identify bullish and bearish pressure and trade aligned with the dominant trend.
Combined with a longer-term moving average, it allows traders to focus on trend-following setups while managing risk effectively.
Its versatility makes it suitable for scalping, day trading, swing trading, and position trading on any currency pair.


