
About the MTF Candlestick Indicator
The MTF Candlestick Indicator for MT4 is a professional utility that enables traders to overlay higher timeframe candles directly onto their current activity chart.
It essentially brings the big picture down to your execution level, ensuring you never lose sight of the primary market direction.
By using this system, you can observe how price action on an M5 or M15 chart develops within the context of an H4 or Daily candle.
The indicator draws a box around the price action to represent the body and wicks of the chosen higher interval.
This allows you to spot high-probability entries, such as when a lower timeframe breakout occurs at the edge of a major daily support or resistance level.
Free Download
Download the “mtf-candlesticks-indicator.mq4” MT4 indicator
Key Features
- Overlays higher timeframe candlestick data onto any lower timeframe activity chart.
- Displays price movement as a box that updates in real-time to match higher timeframe data.
- Allows for full customization of the target timeframe directly from the input tab.
- Features adjustable color settings for bullish and bearish boxes to match your template.
- Eliminates the risk of trading against the dominant trend of the higher market cycles.
Indicator Chart
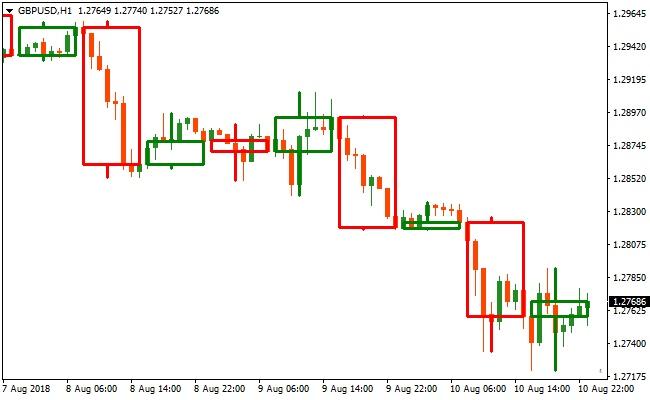
The chart shows the MTF Candlestick Indicator drawing large, shaded boxes over the standard price action.
These boxes represent the candles of a higher timeframe, such as the Daily or H4, while the internal bars show the detailed movements of the current M15 chart.
This layout helps you understand if the current intraday volatility is simply a retracement within a larger trending candle.
Guide to Trade with MTF Candlestick Indicator
Buy Rules
- Select a higher timeframe like the Daily chart in the MTF Candlestick Indicator settings.
- Wait for the higher timeframe box to show a bullish bias or an upward expansion.
- Monitor the lower timeframe for a price rejection at the bottom of the larger box.
- Initiate a long position when a bullish candlestick pattern confirms at a key support area.
Sell Rules
- Choose a significant higher timeframe such as H4 in the indicator input tab.
- Verify that the large box reflects a bearish trend or downward price pressure.
- Look for the price on your lower timeframe to pull back to the top of the higher timeframe box.
- Execute a short trade once a bearish reversal signal occurs near the resistance of the box.
Stop Loss
- For buy trades, place the stop loss below the low of the current higher timeframe box.
- For sell trades, position the stop loss above the high of the active higher timeframe box.
Take Profit
- Target the opposite boundary of the higher timeframe box as an initial profit goal.
- Set a secondary target at the next major horizontal level found on the higher timeframe.
- Close the trade if the price fails to break through a psychological round number.
MTF Candlestick and Super Forex Scalper Indicator Forex Strategy
This MT4 scalping strategy combines the MTF Candlestick MT4 Indicator with the Super Forex Scalper Indicator to create a precise entry system for very short-term trades.
The MTF Candlestick indicator allows you to display higher timeframe candlesticks on a lower timeframe chart, helping traders see larger market context without switching timeframes.
The Super Forex Scalper indicator provides timely buy and sell signals using blue and yellow lines, making scalping entries easier to spot.
This strategy is designed for M1 and M5 charts, ideal for scalpers targeting small but consistent price movements.
It works best on major currency pairs with high liquidity and clear volatility, enabling fast reaction to micro-trend shifts while staying aligned with higher timeframe structure.
Buy Entry Rules
- Observe higher timeframe candlestick structure using the MTF Candlestick indicator and confirm an uptrend on the lower timeframe chart.
- The Super Forex Scalper indicator prints a blue line.
- Enter a buy trade at the close of the candle where the blue line appears.
- Place the stop loss below the recent swing low or below the lower boundary of the higher timeframe candlestick box.
- Exit the trade when a yellow scalper line appears, signaling a trend reversal.
Sell Entry Rules
- Observe higher timeframe candlestick structure using the MTF Candlestick indicator and confirm a downtrend on the lower timeframe chart.
- The Super Forex Scalper indicator prints a yellow line.
- Enter a sell trade at the close of the candle where the yellow line appears.
- Place the stop loss above the recent swing high or above the upper boundary of the higher timeframe candlestick box.
- Exit the trade when a blue scalper line appears, signaling a reversal.
Advantages
- Higher timeframe structure is visible on lower timeframe charts for better context.
- The scalper indicator provides clear visual signals for entry and exit.
- Reduces the guesswork by combining trend direction with precise signal timing.
- Works well in fast-moving markets on M1 and M5 charts.
- Easy to monitor multiple pairs simultaneously.
Drawbacks
- Signals can be affected by short-term noise in very volatile pairs.
- Requires quick execution and discipline due to fast timeframes.
- Needs tight risk management since M1 and M5 trades are sensitive to spread.
- Less effective during low volatility or quiet market sessions.
Case Study 1
On EURCAD M1 during the London session, the MTF Candlestick indicator showed a clearly higher timeframe bullish candlestick structure.
The Super Forex Scalper indicator printed a blue line, confirming upward momentum.
A buy trade was entered at candle close with a stop loss below the lower boundary of the higher timeframe candle.
Price quickly moved in the trend direction and the trade was closed when a yellow line appeared, capturing 11 pips in minutes.
Case Study 2
On AUDNZD M5, the MTF Candlestick indicator displayed a bearish structure on the higher timeframe while the lower timeframe chart allowed precise timing.
The Super Forex Scalper indicator printed a yellow line signaling a sell.
A sell trade was entered at candle close with a stop loss above the upper boundary of the higher timeframe candle.
Price moved downward consistently and the trade was closed when a blue line appeared, securing 24 pips.
Strategy Tips
- Always confirm the higher timeframe structure before taking the lower timeframe signals.
- Focus on major and liquid pairs to avoid erratic price moves.
- Avoid trading immediately before major news releases.
- Use tight stops to protect small profits in fast scalping moves.
- Monitor spread and execution speed carefully on M1 charts.
- Combine multiple pairs to find the best setups without overextending attention.
- Keep sessions short and disciplined to avoid fatigue from constant micro-trade monitoring.
- Review recent candlestick boxes to anticipate potential reversals or breakouts.
Download Now
Download the “mtf-candlesticks-indicator.mq4” Metatrader 4 indicator
FAQ
How do I change the timeframe of the boxes on my chart?
You can easily change the timeframe by accessing the MTF Candlestick Indicator settings in the inputs tab.
There is a specific parameter called timeframe where you can select values like M30, H1, H4, or D1.
Once you press okay, the indicator will automatically recalculate the boxes and draw them based on the new interval you have chosen.
Does this indicator work on non-forex assets like Gold or Indices?
The MTF Candlestick Indicator is fully compatible with any asset that provides candlestick data.
This includes commodities like Gold and Oil, as well as major stock indices.
Summary
The MTF Candlestick Indicator is a professional tool that simplifies the complex task of multi-timeframe analysis.
By integrating higher-level data onto your execution chart, it helps you maintain a disciplined and objective view of the market.
Its primary benefit is the clarity it brings to intraday movements, making it easier to distinguish between minor noise and significant trend developments.
To maximize the utility of this system, focus on trading when the price is near the boundaries of the higher timeframe boxes.


