
About the Neurotrend Indicator
The Neurotrend indicator for MetaTrader 4 is a trend-following stop-and-reverse trading tool designed to identify directional market moves.
It focuses on capturing sustained trends by signaling when market bias shifts from bullish to bearish, or vice versa.
Blue dots appear below candlesticks during upward trend conditions, while red dots appear above candlesticks during downward trend phases.
A dynamic trend line is also drawn to help manage open positions.
Neurotrend can be traded as a standalone indicator due to its straightforward logic.
Many traders still prefer to combine it with additional technical or fundamental tools to filter signals during ranging markets.
The Z and S input values can be adjusted to fine-tune sensitivity based on trading style and timeframe.
Free Download
Download the “neurotrend.mq4” MT4 indicator
Key Features
- Trend-following stop-and-reverse indicator.
- Blue dot signals for bullish conditions.
- Red dot signals for bearish conditions.
- Signals plotted directly on the price chart.
- Dynamic trend line for trade management.
- Adjustable Z and S input parameters.
- Works across all MT4 timeframes and pairs.
Indicator Chart
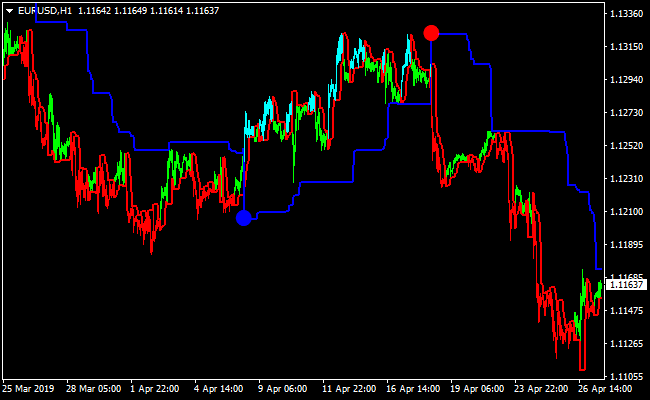
This chart example shows the Neurotrend indicator applied to a price chart.
Blue and red dots mark trend direction, while the trailing line provides a reference for managing risk as price moves in favor of the trade.
Guide to Trade with Neurotrend Indicator
Buy Rules
- Wait for a blue dot to appear below the price candlestick.
- Confirm that the price is moving above the Neurotrend line.
- Open a buy trade at the close of the signal candle.
Sell Rules
- Wait for a red dot to appear above the price candlestick.
- Confirm that the price is moving below the Neurotrend line.
- Open a sell trade at the close of the signal candle.
Stop Loss
- Place the stop loss a few pips below the rising Neurotrend line for buy trades.
- Place the stop loss a few pips above the falling Neurotrend line for sell trades.
- Tighten the stop loss as the trend progresses and new dots form.
Take Profit
- Allow the trade to run until an opposite dot appears.
- Secure partial profits when price accelerates strongly.
- Exit manually if market conditions change abruptly.
NeuroTrend Indicator + Ehlers Histogram Forex Scalping Strategy for MT4
This scalping method combines the NeuroTrend Indicator for MT4 with the Ehlers Histogram Oscillator for MT4.
It is built for fast entries on M1 and M5 charts, using simple color-based confirmations.
NeuroTrend provides the actual entry signal through blue buy dots or red sell dots.
The Ehlers Histogram confirms trend direction with its blue bars for bullish momentum and red bars for bearish momentum.
This setup works extremely well during high-liquidity hours such as the London session or the New York open.
It is ideal for scalpers who want quick, rule-based trades with minimal lag and no complicated chart clutter.
Why This Strategy Works
The NeuroTrend indicator reacts quickly to price shifts and gives straightforward signals using its colored dots.
The Ehlers Histogram is a smooth oscillator that filters noise and reveals the underlying micro-trend.
When both indicators agree, short-term momentum is strong enough to extract consistent scalping profits.
The simplicity of the setup makes it easy to apply, even during fast-moving conditions.
Buy Entry Rules
- Ehlers Histogram must display blue bars, confirming a bullish trend.
- Wait for NeuroTrend to plot a blue dot on the price chart.
- Enter a buy trade on the close of the signal candle.
- Set stop loss below the latest small swing or 5–8 pips below entry on M1 and 10–15 pips on M5.
- Take profit at 5–15 pips depending on volatility.
Sell Entry Rules
- Ehlers Histogram must show red bars, confirming bearish pressure.
- Wait for NeuroTrend to print a red sell dot.
- Enter a sell position on the close of the dot candle.
- Place stop loss above the nearest swing or 5–8 pips above entry on M1 and 10–15 pips on M5.
- Take profit at 5–15 pips, depending on the pair and session movement.
Advantages
- Fast, clean scalping signals with simple color-based rules.
- Strong confirmation by combining price signals with oscillator trend direction.
- Very effective on M1 and M5 charts.
- Suitable for beginners because the rules are visually simple.
- No laggy moving averages or complicated filters needed.
Drawbacks
- Requires fast execution; slow entries often lose several pips immediately.
- Not reliable on exotic or low-liquidity currency pairs.
- Asian session choppiness often produces false alternating signals.
- Each pair may require different stop-loss and take-profit settings.
Example Case Study 1
On EURUSD M1 during the London session, the Ehlers Histogram turned blue after a small bullish breakout.
A few candles later, NeuroTrend printed a blue dot, creating the buy signal.
The entry was taken immediately at the candle close with a stop loss 6 pips below the recent swing.
Momentum picked up quickly.
Price pushed upward in a clean wave, reaching about 9 pips in profit within minutes.
Once the histogram began to shrink and lose intensity, the trade was closed, securing most of the move before a minor pullback occurred.
Example Case Study 2
On GBPUSD M5 during the New York open, the Ehlers Histogram switched to red, showing strong bearish momentum.
Shortly after, NeuroTrend plotted a red dot.
A sell trade was executed on the candle close with a stop loss placed 12 pips above.
The pair dropped sharply as volatility increased, delivering a smooth 14-pip move.
As the histogram began transitioning toward lighter shades, hinting at decreasing momentum, the trade was closed, capturing nearly the entire downward push.
Strategy Tips
- Focus on major pairs with tight spreads for consistent scalping.
- Best session for this system: London, London–NY overlap and early NY.
- Avoid trading when the histogram switches colors repeatedly.
- Use slightly larger targets on M5 because signals occur less frequently.
- Stop trading if the spread widens unexpectedly due to news or low liquidity.
Download Now
Download the “neurotrend.mq4” Metatrader 4 indicator
FAQ
Is Neurotrend a repainting indicator?
Signals are confirmed after candle close, which helps keep historical dots stable once plotted.
How do the Z and S settings affect performance?
Lower values increase sensitivity and signal frequency, while higher values smooth signals and reduce noise.
Summary
The Neurotrend MT4 indicator provides a straightforward way to follow market trends using visual dot signals and dynamic stop guidance.
Its stop-and-reverse logic helps traders stay aligned with dominant price movement.
With adjustable settings and simple signal interpretation, Neurotrend suits traders who prefer trend-based strategies.
Additional confirmation tools can further enhance performance, especially during periods of reduced volatility.


