About the OsMA Indicator
The Oscillator of Moving Average, commonly called OsMA, is a momentum indicator that helps traders spot overbought and oversold market conditions.
It functions similarly to the MACD but focuses on the difference between the MACD line and its signal line.
OsMA fluctuates above and below a zero line.
Values above zero indicate bullish momentum, while values below zero indicate bearish momentum.
This makes it easy to identify potential entries in the direction of the prevailing price movement.
The indicator works best when combined with a trend-following tool, such as a longer-term moving average.
By trading OsMA signals that align with the main trend, traders can filter out countertrend noise and improve trade quality.
Free Download
Download the “OsMA.mq4” MT4 indicator
Key Features
- Displays bullish and bearish momentum using a zero-based oscillator.
- Highlights overbought and oversold market conditions.
- Works alongside trend-following indicators for higher probability trades.
- Suitable for multiple trading styles and all currency pairs.
- Provides a simple visual way to align trades with momentum.
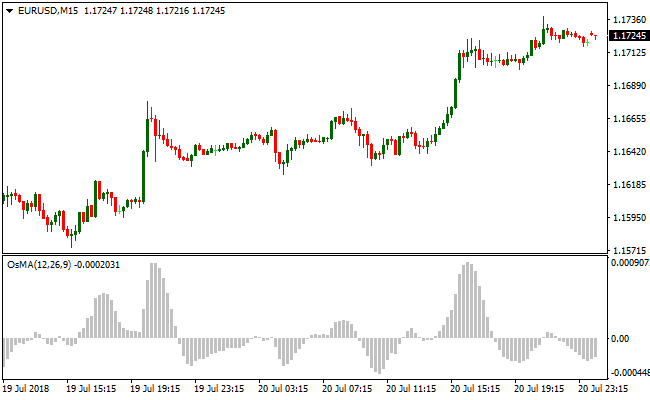
Indicator Chart
The OsMA indicator appears beneath the main price area as a histogram fluctuating above and below the zero line.
Bars above zero suggest bullish momentum and potential buy trades, while bars below zero indicate bearish momentum and potential sell trades.
The histogram makes it easy to spot trend-aligned entries.

Guide to Trade with the OsMA Indicator
Buy Rules
- Wait for OsMA bars to appear above the zero line.
- Confirm the overall trend is upward with a longer-term moving average.
- Enter a buy trade when momentum strengthens above zero.
Sell Rules
- Wait for OsMA bars to appear below the zero line.
- Confirm the overall trend is downward with a longer-term moving average.
- Enter a sell trade when momentum strengthens below zero.
Stop Loss
- Place the stop below the most recent swing low for buy trades or above swing high for sell trades.
- Exit trades if OsMA reverses and crosses the zero line prematurely.
- Adjust stop based on volatility or nearby support/resistance levels.
- Close trades if momentum fails to follow through in the trade direction.
Take Profit
- Close buy trades when OsMA starts losing upward momentum.
- Close sell trades when OsMA shows weakening downward momentum.
- Secure partial profits near significant support or resistance zones.
- Exit fully if OsMA reverses across the zero line or an opposite trend signal forms.
Zero Lag Moving Average and OSMA Forex Trend Confirmation Strategy for MT4
This MT4 trend strategy combines the OSMA indicator with the Zero Lag Moving Average indicator to capture trend aligned moves with strong confirmation.
The Zero Lag Moving Average shows the price direction quickly and clearly by using a smooth moving average that reacts faster than traditional MA.
The OSMA histogram confirms momentum by showing whether the market is truly bullish or bearish.
When both indicators agree, this strategy enters trades with better probability and manages exits based on changes in momentum and trend direction.
This approach works on M5, M15, and H1 timeframes.
It is designed for traders who prefer to follow trends but want additional confirmation to reduce whipsaws.
The Zero Lag Moving Average helps identify whether the price is above or below a significant dynamic level.
The OSMA histogram then confirms that momentum aligns with the trend direction.
The result is a structured yet flexible strategy that captures realistic pip moves in trending conditions.
Buy Entry Rules
- Ensure price is above the Zero Lag Moving Average, indicating bullish trend direction.
- Confirm that the OSMA histogram is above the zero line, showing bullish momentum.
- Enter a buy trade at the close of the candle where both conditions align.
- Place the stop loss just below the Zero Lag Moving Average or a recent swing low.
- Exit the trade when the OSMA histogram drops below zero or price closes below the Zero Lag Moving Average.
Sell Entry Rules
- Ensure price is below the Zero Lag Moving Average, indicating bearish trend direction.
- Confirm that the OSMA histogram is below the zero line, showing bearish momentum.
- Enter a sell trade at the close of the candle where both conditions align.
- Place the stop loss just above the Zero Lag Moving Average or a recent swing high.
- Exit the trade when the OSMA histogram rises above zero or price closes above the Zero Lag Moving Average.
Advantages
- Provides clear trend and momentum alignment for high probability trades.
- Easy to identify entry and exit points using visual indicators.
- Adaptive across multiple timeframes from M5 to H1.
- Helps traders stay in trades longer while the trend continues.
Drawbacks
- May generate delayed entries after initial trend moves have started.
- False signals can occur in low volatility or choppy markets.
- Requires constant monitoring to exit trades as momentum changes.
- Smaller profits may result if the OSMA reverses quickly before a larger trend develops.
Example Case Study 1
On the M15 EURCHF chart, price consistently closed above the Zero Lag Moving Average indicating a bullish trend.
The OSMA histogram moved above zero and expanded, confirming strong momentum.
A buy trade was entered at the close of the confirming candle and the stop loss was placed below the moving average.
Price continued higher, and the trade was closed when the OSMA histogram dipped below zero.
The trade captured 38 pips as momentum weakened and the trend showed early signs of reversal.
Example Case Study 2
On the H1 GBPJPY chart, price moved below the Zero Lag Moving Average showing bearish direction.
The OSMA histogram was also below zero and increasing downward pressure.
A sell trade was entered at the close of the confirming candle and the stop loss was placed above the moving average.
Price continued lower for several hours and the trade was closed when the price crossed above the Zero Lag Moving Average.
The trade captured 92 pips before the trend turned.
Strategy Tips
- Prioritize trades where price is clearly above or below the Zero Lag MA with a strong slope.
- Confirm the OSMA histogram is aligned with the MA trend before entering to avoid false entries.
- Consider trading only in the direction of the higher timeframe trend for stronger signals.
- Use support and resistance levels to filter entries and improve risk-reward ratios.
- Move the stop loss to breakeven once price has moved favorably to protect against reversals.
- Avoid trading during low liquidity periods to reduce the chance of whipsaw movements.
- Re-enter trades only after the MA and OSMA realign following minor pullbacks.
Download Now
Download the “OsMA.mq4” Metatrader 4 indicator
FAQ
What is the main purpose of the OsMA indicator?
It identifies bullish and bearish momentum and highlights overbought or oversold conditions to assist with timing trades in the direction of the main trend.
Can OsMA be used alone for trading?
Yes, but combining it with a trend filter like a moving average improves accuracy and reduces false signals.
Summary
The OsMA indicator provides a clear view of market momentum by highlighting bullish and bearish conditions relative to a zero line.
Its histogram format makes trend-aligned entries simple to identify.
When combined with a longer-term trend filter, OsMA helps traders take trades in the direction of the dominant trend while managing risk effectively.
Its versatility makes it suitable for scalping, day trading, swing trading, and longer-term strategies on MT4.


