
The Perfect Trend Line (PTL) Forex Signal indicator for Metatrader 5 forecasts buy and sell trends based on trend lines.
The indicator appears in the price chart as a blue/red colored signal line and performs the best in trending markets.
The Perfect Trend Line is always active in the market, either with a buy or sell trade.
How does it work?
- The blue colored signal line forecasts a bullish trend.
- The red colored signal line forecasts a bearish trend.
For short-term traders: deploy the PTL indicator during the London and New York trading sessions for best results.
The indicator contains the following inputs and parameters: fast length, and slow length.
Make yourself familiar with this technical indicator and test it first on a demo account.
Remember to have realistic expectations, performance will vary depending on market conditions (trending markets, sideways markets, etc.).
Download Indicator 🆓
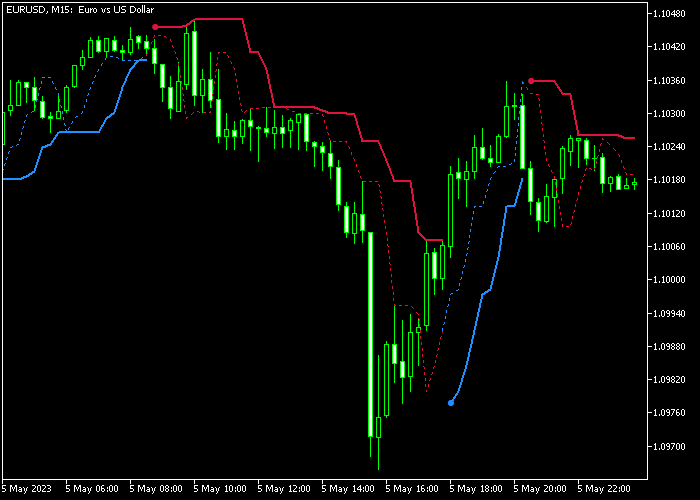
Chart Example
The following chart shows what the Perfect Trend Line Forex Signal indicator looks like when applied to the MT5 chart.
How To Buy And Sell Forex Pairs With The Perfect Trend Line (PTL) Forex Signal Indicator?
Find a simple trading example below:
Buy Signal
- The appearance of the blue PTL line is a buy signal.
- Open a buy trade and place your stop loss below the blue PTL line.
- Close the buy trade for a reward to risk ratio of 2.0, or hold the trade until the red PTL line gets displayed on the price chart.
Sell Signal
- The appearance of the red PTL line is a sell signal.
- Open a sell trade and place your stop loss above the red PTL line.
- Close the sell trade for a reward to risk ratio of 2.0, or hold the trade until the blue PTL line gets displayed on the price chart.
Download Now 🆓
Frequently Asked Questions
How Do I Install This Custom Indicator On Metatrader 5?
- Open the MT5 trading platform
- Click on the File menu button located at the top left part of the platform
- Click on Open Data Folder > MQL5 folder > Indicators
- Copy the PTL.mq5 indicator file in the Indicators folder
- Close and restart the trading platform
- You will find the indicator here (Navigator window > Indicators)
- Drag the indicator to the chart to get started with it!
How Do I Edit This Indicator?
- Click in the open chart with your right mouse button
- In the dropdown menu, click on Indicator List
- Select the indicator and click on properties
- Now you can edit the inputs, colors, levels, scale and visualization
- Finally click the OK button to save the new configuration


