
About the Perfect Trend Line Indicator
The Perfect Trend Line indicator for MT4 is a trend-based buy and sell signal tool that removes the need for manual trend line drawing.
It automatically analyzes price action and calculates trend line behavior in the background, presenting the results as simple visual signals.
Instead of forcing traders to interpret complex chart patterns, the indicator converts trend line logic into clear dots displayed directly on the price chart.
A green dot below the candle signals bullish conditions, while a violet dot above the candle signals bearish momentum.
This approach makes the indicator especially useful for traders who want to follow trends without cluttering their charts.
The indicator continuously adapts to market conditions and updates its internal trend lines as price evolves.
Free Download
Download the “perfect-trend-line-indicator.ex4” MT4 indicator
Key Features
- Automatically calculates trend line-based signals.
- No manual drawing or adjustment required.
- Green and violet dots for clear trade direction.
- Dynamic support and resistance trend lines.
- Works on all MT4 timeframes and currency pairs.
Indicator Chart
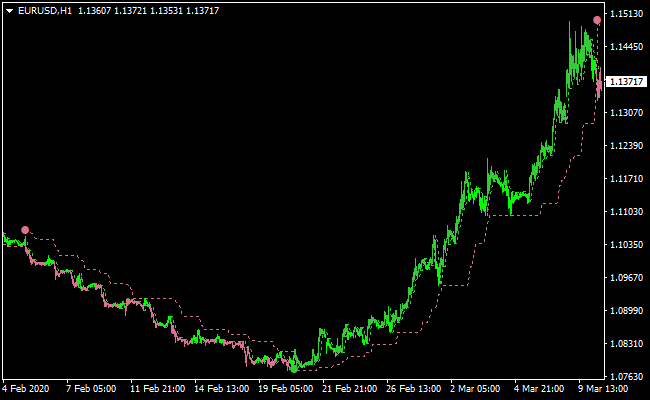
The chart displays the Perfect Trend Line indicator applied to an MT4 price chart.
Green dots appear below candles during bullish trends, while violet dots appear above candles during bearish trends.
Dotted trend lines act as dynamic support and resistance zones for trade management.
Guide to Trade with Perfect Trend Line Indicator
Buy Rules
- Open a buy trade when a green dot appears below the candlestick.
- Confirm that price is moving in a bullish trend.
- Prefer buy signals after a pullback within the trend.
Sell Rules
- Open a sell trade when a violet dot appears above the candlestick.
- Confirm that price is moving in a bearish trend.
- Prefer sell signals after corrective moves within the trend.
Stop Loss
- Place the stop loss below the violet dotted rising support line for buy trades.
- Place the stop loss above the violet dotted falling resistance line for sell trades.
- Adjust stops as the trend line updates and price moves in favor.
Take Profit
- Set take profit at previous swing highs or lows.
- Use trailing stops along the trend line to stay in strong moves.
- Close the trade if an opposite signal dot appears.
Perfect Trendline + SIBBET Demand Index Divergence MT4 Day-Trading Strategy
This MT4 day-trading strategy combines the trend-direction clarity of the Perfect Trend Line indicator with the strength and exhaustion signals from the SIBBET Demand Index Divergence Indicator.
The Perfect Trendline draws green dots for bullish trend points and violet dots for bearish trend points, helping you identify when the market’s trend structure is favorable.
The SIBBET Demand Index Divergence indicator plots a histogram: green bars suggest increasing buying demand (buy potential), while red bars point to growing selling pressure (sell potential).
By combining a reliable trend filter with a divergence-based momentum indicator, this strategy helps you catch intraday reversals or continuation moves with good probability.
It’s intended for day traders working on M15 or M30 charts, using pairs that offer reasonable volatility during major sessions (like EUR/USD, GBP/JPY, AUD/USD).
Because divergence often precedes turning points or trend accelerations, the Demand Index helps you time entries more precisely.
Buy Entry Rules
- The Perfect Trendline plots a green dot indicating a bullish trend change or confirmation.
- The SIBBET Demand Index Divergence histogram shows a green bar or rising green bars, signaling increasing buying demand.
- Enter a long (buy) trade when both conditions are present on the same or closely aligned candles.
- Set your stop loss just below a recent swing low or below the candle that formed the green trend dot.
- Take profit once the Demand Index histogram begins to turn down (green bars shrinking) or reverses color to red.
Sell Entry Rules
- The Perfect Trendline plots a violet dot indicating a bearish trend change or confirmation.
- The SIBBET Demand Index Divergence histogram shows a red bar or strengthening red bars, signaling increasing selling pressure.
- Enter a short (sell) trade when both conditions align on the same or consecutive candles.
- Place the stop loss just above a recent swing high or above the candle that produced the violet dot.
- Take profit when the Demand Index histogram starts to fade (red bars shrinking) or flips to green, indicating waning selling pressure or a possible shift in demand.
Advantages
- Uses a clear trend-filter: only trade in the direction suggested by Perfect Trendline dots.
- Divergence-based entries help catch turning points and avoid late entries.
- The Demand Index is more sensitive to underlying buying/selling pressure than price alone, giving early warning.
- Dynamic take-profit based on histogram behavior helps lock in gains without fixed pip targets.
- Well-suited for intraday trading: low to medium risk, controlled stops, and good risk/reward opportunities.
Drawbacks
- Missed signals: trend dots and divergence may not always align, reducing the number of trades.
- False divergences: sometimes the Demand Index shows divergence, but the price continues strongly in the trend.
- Lags on fast moves: the trend dot may appear slightly late after a strong breakout, meaning entry might not be optimal.
- Stop loss may be relatively wide if swing points are distant, depending on the pair and the timeframe.
- Requires careful monitoring: watching the histogram shape and trend dots means more active management.
Example Case Study 1: EUR/USD M15 During London Session
During a London-session swing, EUR/USD on the M15 chart showed a green Perfect Trendline dot at 1.1030, signaling a shift to bullish direction.
Shortly afterward, the SIBBET Demand Index histogram produced rising green bars, indicating growing buying momentum.
Based on these two signals, a long trade was entered at 1.1035.
The stop loss was placed just below the recent swing low at 1.1018.
As the price climbed, the Demand Index green bars reached a peak, then began to shrink.
When the histogram reversed color to red, the trader closed the position around 1.1058, locking in a sensible intraday profit without overextending.
Example Case Study 2: GBP/JPY M30 Reversal Move
On GBP/JPY in a 30-minute timeframe, a violet dot from the Perfect Trendline appeared at 153.25 as the pair recovered near a resistance area.
Right after, the SIBBET Demand Index showed strong red bars, signaling selling pressure. The trader initiated a short at 153.20.
A stop loss was set just above the swing high at 153.50.
As the price moved downward, the red bars intensified, then gradually diminished.
When the histogram flipped back to green, the trade was closed at 152.85, capturing a clean intraday reversal.
Strategy Tips
- Stick to M15 or M30 timeframes: they allow a balance between signal clarity and frequent opportunities.
- Avoid trading during major news announcements unless you’re very confident; divergence signals may behave unpredictably.
- Use proper money management: risk only a small percentage per trade, as not every divergence will play out fully.
- Watch the histogram shape carefully: don’t just trade a green bar, but wait for the trend of bars (rising or fading) to make your exit decision.
- Backtest the strategy on your preferred currency pairs to validate how often trend dots + divergence align and how reliable your profit-taking rule is.
Download Now
Download the “perfect-trend-line-indicator.ex4” Metatrader 4 indicator
FAQ
How does the indicator calculate trend lines?
The indicator uses internal algorithms to track price swings and trend direction, translating that data into automated trend lines.
Do the signal dots repaint?
No, dots are based on completed price data. Once a dot appears, it remains on the chart.
Summary
The Perfect Trend Line indicator for MT4 offers a hands-off approach to trend trading.
Automating trend line analysis and presenting signals as clear visual markers simplifies decision-making.
Its dynamic stop loss guidance and adaptability across markets make it a practical choice for traders who want to follow trends without manual chart work.
With disciplined execution and proper risk control, it can serve as a reliable trend-following component in a trading strategy.


