About the Phoenix Forex Indicator
The Phoenix Forex Indicator for MT4 combines a simple moving average with the OSMA oscillator to detect overbought and oversold areas inside a defined range.
When price moves toward the extremes of the range, the indicator reacts by plotting arrow signals directly on the chart.
These arrows highlight potential reversal points where price may rotate back toward the middle of the range.
Blue arrows appear when the market reaches oversold conditions, signaling a possible buying opportunity.
Red arrows form when price becomes overbought, pointing to potential sell setups.
This indicator performs best when volatility is controlled and price moves sideways.
In trending markets, signals can lose accuracy, which is why market condition analysis plays a key role when using Phoenix.
Traders often pair it with basic trend filters or higher time frame analysis to confirm that the market is ranging before acting on signals.
Free Download
Download the “phoenix-indicator.mq4” MT4 indicator
Key Features
- Uses a simple moving average to define price behavior.
- Integrates the OSMA oscillator to measure momentum extremes.
- Displays buy and sell arrows directly on the chart.
- Designed specifically for range-bound market environments.
- Helps identify overbought and oversold zones efficiently.
- Works on multiple currency pairs and timeframes.
Indicator Chart
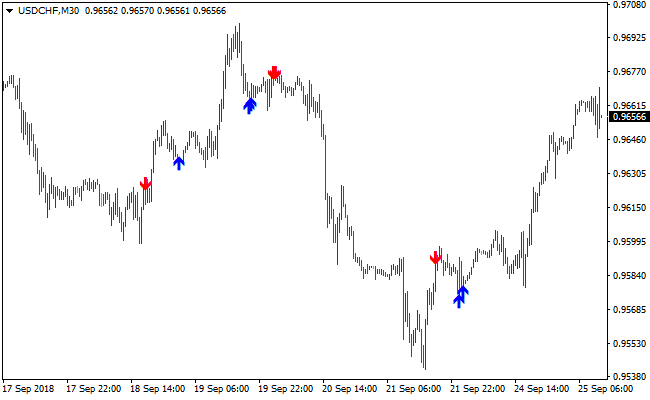
The chart below shows the Phoenix Forex Indicator applied to a ranging market.
Buy and sell arrows appear near the upper and lower boundaries of the range, highlighting potential reversal areas.
The indicator visually tracks momentum shifts that align with oversold and overbought conditions.

Guide to Trade with the Phoenix Forex Indicator
Buy Rules
- Confirm that the market is moving sideways on the current timeframe.
- Wait for price to approach the lower boundary of the range.
- Look for a blue arrow printed by the Phoenix indicator.
- Enter a buy trade at the opening of the next candle.
Sell Rules
- Verify that the market is not trending strongly.
- Allow price to reach the upper boundary of the range.
- Wait for a red arrow to appear on the chart.
- Enter a sell trade at the next candle open.
Stop Loss
- Place the stop loss just beyond the recent range high or low.
- Use a fixed pip stop based on the average range size.
- Avoid tight stops that sit inside normal price noise.
- Adjust risk according to timeframe volatility.
Take Profit
- Close the trade when an opposite arrow appears.
- Target the midpoint of the range for conservative exits.
- Use the opposite range boundary as an extended target.
- Manually exit if price starts trending strongly.
Phoenix and Simpler Trend Forex Strategy for MT4
This strategy combines the precise entry signals of the Phoenix MT4 Indicator with the trend-confirming power of the Simpler Trend MT4 Indicator.
The approach helps traders follow strong trends while filtering out false signals.
It works well on time frames from 15 minutes to 1 hour and is suitable for both day traders and swing traders.
The strategy is ideal for pairs with clear trending behavior and higher volatility.
Buy Entry Rules
- Observe the Simpler Trend indicator on the main chart. Confirm that the candlesticks are green, indicating a bullish trend.
- Wait for the Phoenix MT4 Indicator to display a blue arrow, signaling a buy opportunity.
- Enter a buy trade when both the trend and the Phoenix signal align.
- Place your stop loss below the most recent swing low or below the last red candlestick.
- Close the trade when the Phoenix indicator gives a sell signal or the Simpler Trend turns red.
Sell Entry Rules
- Confirm that the Simpler Trend indicator shows red candlesticks, indicating a bearish trend.
- Wait for the Phoenix MT4 Indicator to display a red arrow, signaling a sell opportunity.
- Enter a sell trade when both indicators align.
- Place your stop loss above the most recent swing high or above the last green candlestick.
- Close the trade when the Phoenix indicator gives a buy signal or the Simpler Trend turns green.
Advantages
- Combines trend-following with clear entry signals for higher accuracy.
- Reduces false entries by requiring both indicators to align.
- Easy to interpret with visual arrows and colored candlesticks.
- Works across multiple time frames for both short-term and medium-term trades.
Drawbacks
- Signals may lag slightly in fast-moving markets or during major news events.
- Trades can be missed if waiting for both indicators to align strictly.
Case Study 1: NZDUSD Buy Trade
On the NZDUSD 30-minute chart, the Simpler Trend indicator showed green candlesticks, confirming a bullish trend.
The Phoenix indicator then displayed a blue arrow.
Entry was made at 0.6150, with the stop loss set below the recent swing low at 0.6135.
The market moved steadily upwards, allowing the trade to remain open for several hours until the trend slowed and the Phoenix indicator turned red, signaling an exit.
Case Study 2: USDCAD Sell Trade
On the USDCAD 15-minute chart, the Simpler Trend indicator displayed red candlesticks, confirming a bearish trend.
The Phoenix indicator showed a red arrow, providing a sell signal.
Entry was taken at 1.3450, with a stop loss above the recent swing high at 1.3470.
The market declined sharply as the trend continued, and the trade was closed when the Phoenix indicator signaled a buy, capturing the downward move effectively.
Strategy Tips
- Focus on currency pairs with clear trends for more consistent results.
- Use higher time frames for trend confirmation and lower time frames for timing entries.
- Trade during major sessions like London and New York for higher liquidity and stronger moves.
- Monitor price action around support and resistance levels to enhance entries and exits.
- Wait for both indicators to confirm the signal rather than trading every arrow.
- Backtest the strategy on historical data and practice in a demo account before live trading.
Download Now
Download the “phoenix-indicator.mq4” Metatrader 4 indicator
FAQ
Which market conditions suit the Phoenix Forex Indicator best?
The indicator performs strongest in sideways markets where price respects clear range boundaries and momentum oscillates regularly.
What timeframe works best with this indicator?
Lower and medium timeframes such as M15 to H1 tend to deliver smoother range behavior, though higher timeframes can also work.
Summary
The Phoenix Forex Indicator focuses on capturing reversal opportunities inside range-bound markets.
By combining a simple moving average with the OSMA oscillator, it highlights overbought and oversold zones using intuitive arrow signals.
Its strength lies in simplicity and visual clarity, making it accessible for traders who prefer structured range trading strategies.
While it requires careful market condition filtering, the Phoenix indicator remains a practical tool when applied with discipline and confirmation.


