
About the Price Action Forex Trend Indicator
The Price Action Forex Trend indicator for Metatrader 4 is designed for traders who prefer to read the market without heavy indicators.
It focuses purely on price behavior and trend movement to generate actionable trading signals.
Instead of relying on lagging calculations, the indicator interprets how price reacts and flows over time.
Signals are displayed directly on the chart using green and pink candlestick-based markers.
A green signal reflects bullish momentum and trend continuation.
A pink signal reflects bearish pressure and potential downside movement.
Because the indicator does not repaint, every signal stays fixed once printed.
This makes it suitable for both live trading and historical analysis.
Traders often use it as a core trend tool or as confirmation for existing price action strategies.
Free Download
Download the “Price action trend.mq4” indicator for MT4
Key Features
- Uses pure price action logic to identify trend direction.
- Displays buy and sell signal arrows directly on the chart.
- Non-repaint behavior ensures consistent and reliable signals.
- Easy to understand signals suitable for all experience levels.
Indicator Chart
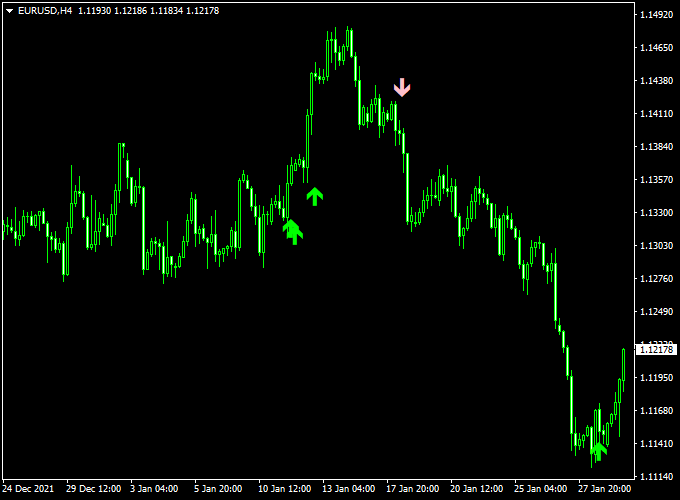
The Price Action Forex Trend indicator chart shows green and pink signal arrows aligned with price movement.
Green arrows highlight bullish trend phases and buying pressure.
Pink arrows mark bearish conditions and selling momentum.
The chart helps traders quickly identify the dominant trend and potential entry zones.
Signals appear only when price action supports the directional bias.
This keeps the chart clean and focused on meaningful opportunities.
Guide to Trade with Price Action Forex Trend Indicator
Buy Rules
- Wait for a green signal arrow to appear on the chart.
- Confirm that price is making higher highs or higher lows.
- Enter a buy trade at the close of the signal candle.
Sell Rules
- Wait for a pink signal arrow to appear on the chart.
- Confirm that price is forming lower highs or lower lows.
- Enter a sell trade at the close of the signal candle.
Stop Loss
- Place the stop loss below the recent swing low for buy trades.
- Place the stop loss above the recent swing high for sell trades.
- Allow enough space for normal price fluctuations.
Take Profit
- Take profit when an opposite colored arrow appears on the chart.
- Use a fixed risk-to-reward ratio such as 1:2 or higher.
- Trail the stop loss as the trend continues in your favor.
Price Action Trend + SuperTrend MTF Forex Intraday Strategy
This intraday strategy combines the Price Action Forex Trend Indicator, which plots green arrows for buy entries and pink arrows for sell entries, with the SuperTrend MTF Forex Signal Indicator,
whose green line signals a bullish trend and red line signals a bearish trend.
Together, they help you trade in the direction of the trend while using arrow signals for timing entries.
This method works best on the M15 and M30 timeframes during active trading hours.
It is suitable for intraday traders who prefer clear visual entry arrows and trend confirmation.
You will enter only when the arrow aligns with the SuperTrend direction, reducing false entries and improving overall accuracy.
Buy Entry Rules
- Wait for a green arrow from the Price Action Trend indicator (buy signal).
- Confirm that the SuperTrend MTF line is green (indicating an uptrend).
- Enter long at the close of the candle with the green arrow, assuming the SuperTrend line is already green.
- Place stop loss just below the recent swing low or a fixed pip amount (for example, 20 pips, depending on pair volatility).
- Take profit at the next resistance zone or target a multiple of your risk (for example, 1.5× to 2×).
- Optionally trail your stop once the price moves in your favor.
Sell Entry Rules
- Wait for a pink arrow from the Price Action Trend indicator (sell signal).
- Confirm that the SuperTrend MTF line is red (indicating a downtrend).
- Enter short at the close of the candle with the pink arrow if the SuperTrend line is red.
- Place a stop loss just above the recent swing high or use a fixed pip stop (for example, 20 pips).
- Take profit at the next support or aim for a risk-reward of 1.5× to 2×.
- You can trail the stop once the trade is in profit.
Advantages
- Clear visual entry arrows make it easy to spot signals.
- Trend confirmation with the SuperTrend MTF line filters out countertrend arrows.
- Works intraday without needing to hold trades overnight.
- Applicable to many major currency pairs (EUR/USD, AUD/USD, USD/JPY, etc.).
- Allows for disciplined entries and structured risk control.
Drawbacks
- During choppy or sideways markets, arrows may fire frequently but yield poor trades.
- Arrows might appear late relative to price movement, reducing reward potential.
- SuperTrend line might repaint or lag slightly, causing delayed confirmation.
- High spreads or slippage can erode profits when using small targets.
- In fast news-driven moves, signals can break down and lead to losses.
- Requires strict risk management—losing trades can accumulate quickly in scalping strategies.
Example Case Study 1
On EUR/JPY (M15), a green arrow appeared at 11:00.
At that moment, the SuperTrend MTF line was already green.
A long position was entered at 145.80, stop loss placed at 145.60 (20 pips), and a target set at 146.20 (40 pips).
The market rose steadily over the next hour and hit the take profit level, resulting in +40 pips.
Example Case Study 2
On AUD/USD (M30), at 14:45, a pink arrow (sell) showed up.
The SuperTrend MTF line had turned red just earlier.
A short entry was taken at 0.6785, stop loss at 0.6805 (20 pips), and take profit aimed at 0.6745 (40 pips).
The pair declined over the next 90 minutes and reached the target, yielding +40 pips.
Strategy Tips
- Open a buy position only when you see a green arrow and the SuperTrend line is green concurrently.
- Open a sell position only when a pink arrow appears and the SuperTrend line is red.
- Stick to high liquidity sessions (London, New York) when price moves are stronger and trends are clearer.
- Avoid taking signals close to major news events; too much volatility can break the rules.
- If a trade moves in your favor by half your target, consider shifting your stop to breakeven or trail it to lock in gains.
Download Now
Download the “Price action trend.mq4” indicator for Metatrader 4
FAQ
How often does the indicator generate signals?
Signal frequency depends on market activity and volatility.
During strong trends, signals may appear more frequently.
In slow or sideways markets, signals are naturally reduced.
Does the indicator work better in trending or ranging markets?
The indicator is designed to follow directional price movement.
Trending conditions usually deliver more consistent results than tight ranges.
Can the indicator help with trade exits as well?
Yes, opposite signal arrows can be used as exit cues.
Some traders also use them to reduce position size or lock in profits.
Is manual confirmation still required before entering trades?
While the signals are reliable, confirmation improves results.
Checking recent price behavior and key levels adds an extra layer of confidence.
Summary
The Price Action Forex Trend indicator for MT4 focuses on what matters most: price movement.
By translating raw price behavior into directional signals, it simplifies trend trading without overloading the chart.
Its non-repaint nature allows traders to trust what they see in real time.
The indicator adapts well across different markets and time frames.
It fits traders who prefer clean charts and disciplined entries.
When paired with solid risk management, it supports steady and controlled trading decisions.
While no tool replaces experience, this indicator offers a dependable framework.
It encourages patience, trend alignment, and consistency.
Over time, it can help traders refine execution and stay aligned with the dominant market direction.


