
About the Price Action Indicator
The Price Action indicator for MT4 is an essential tool for traders who rely on pure price action analysis.
It provides a wide range of information directly on the chart, including trend lines, Fibonacci retracement levels, trading sessions, and stop hunting zones.
A mini dashboard shows the currency pair, current quote, spread, point value, daily and weekly range, and candlestick patterns for daily, weekly, and monthly charts.
This indicator helps traders spot high-probability setups using trend line breaks, retracement levels, and session analysis.
It is fully customizable via the input menu, allowing you to adjust colors, levels, and displayed data to suit your trading strategy.
Free Download
Download the “price-action-indicator.ex4” MT4 indicator
Key Features
- Mini dashboard with currency pair, quote, spread, point value, daily/weekly ranges, and candlestick patterns.
- Displays current and past trading sessions in color-coded format.
- Shows major and minor trend lines on any chart.
- Plots Fibonacci retracement levels for daily, weekly, and monthly timeframes.
- Highlights possible stop hunting zones for buy and sell trades.
- Fully customizable from the indicator input menu.
Indicator Chart
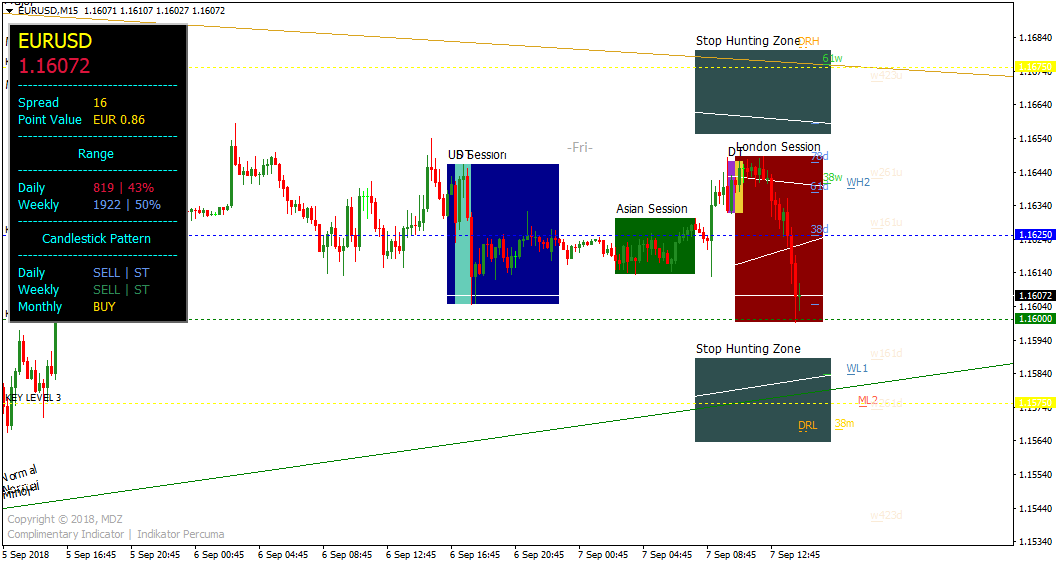
The Price Action indicator displays trend lines, Fibonacci levels, stop hunting zones, and trading sessions directly on the MT4 chart.
The mini dashboard provides key information at a glance.
This visual layout helps traders spot retracements, breakouts, and trend reversals efficiently and trade with confidence.
Guide to Trade with Price Action Indicator
Buy Rules
- Look for price closing above a broken upper major trend line.
- Consider buying at a pullback to a key Fibonacci retracement level, such as 38.2%.
- Ensure the trend is upward by checking higher highs and higher lows.
- Avoid buying near major resistance or stop hunting zones.
Sell Rules
- Look for price closing below a broken lower major trend line.
- Consider selling at a rally to a key Fibonacci retracement level, such as 38.2%.
- Ensure the trend is downward by checking lower highs and lower lows.
- Avoid selling near major support or stop hunting zones.
Stop Loss
- Place the stop loss just beyond the nearest support for buy trades.
- Place the stop loss just beyond the nearest resistance for sell trades.
- Consider the previous candlestick wicks to avoid getting stopped by normal market noise.
Take Profit
- Take profit at the next key trend line or Fibonacci level in the trade direction.
- Partially close trades near session highs or lows for intraday targets.
- Use trailing stops along trend lines to lock in profits as the trend extends.
- Exit if the price forms a reversal candlestick pattern near important support or resistance.
Price Action Indicator + Jevel Trend Bar Day Trading Method for MT4
This MT4 day trading strategy combines the Price Action Indicator and the Jevel Trend Bar Indicator to identify high-probability intraday trades.
The Price Action indicator provides comprehensive market data including currency pair, current quote, spread, daily and weekly range, candlestick patterns, trading sessions, trend lines, Fibonacci retracement levels, and stop hunting zones.
The Jevel Trend Bar indicator confirms the market trend with green bars for bullish momentum and orange bars for bearish momentum, helping traders align their trades with the prevailing trend.
This strategy works best on M15, M30, and H1 charts, allowing traders to catch medium-term intraday trends.
By combining detailed price action analysis with trend bar confirmation, traders can identify strong trading setups while filtering out low-probability trades.
This method is ideal for day traders who want to maximize intraday opportunities with structured rules.
Buy Entry Rules
- The Jevel Trend Bar indicator shows green bars, indicating bullish momentum.
- Price Action indicator confirms trend alignment, with price above key trend lines or Fibonacci support levels.
- Enter the trade when both trend and price action conditions are met.
- Place stop loss below the nearest swing low or significant support level.
- Take profit when the Jevel Trend Bar changes from green to orange or after capturing 25-40 pips.
Sell Entry Rules
- The Jevel Trend Bar indicator shows orange bars, indicating bearish momentum.
- Price Action indicator confirms trend alignment, with price below key trend lines or Fibonacci resistance levels.
- Enter the trade when both trend and price action conditions are met.
- Place a stop loss above the nearest swing high or significant resistance level.
- Take profit when the Jevel Trend Bar changes from orange to green or after capturing 25-40 pips.
Advantages
- Combines detailed price action analysis with trend confirmation for higher probability trades.
- Visual alerts and dashboards simplify trading decisions and market monitoring.
- Effective across multiple intraday timeframes for day trading.
- Helps avoid counter-trend trades by requiring trend alignment.
- Provides additional insights with Fibonacci levels and stop hunting zones.
Drawbacks
- Performance can be reduced in choppy or sideways markets where trend signals may give false entries.
- Requires active monitoring of multiple price action elements, which can be overwhelming for beginners.
- May require patience as setups are only valid when trend and price action align, reducing the number of trade opportunities.
Case Study 1: EURAUD M30
During the London session, EURAUD showed green Jevel Trend Bars while the Price Action indicator confirmed that price was above key trend lines and Fibonacci support levels.
A buy trade was entered with a stop loss below the recent swing low.
Price continued upward, and the trade was closed when the trend bars turned orange, capturing a 32 pip gain.
Using both indicators together provided a reliable day trading setup.
Case Study 2: GBPUSD H1
GBPUSD displayed orange Jevel Trend Bars during the New York session, with Price Action confirming price below major trend lines and Fibonacci resistance.
A sell trade was executed with a stop above the recent swing high.
Price declined steadily and the trade was closed when the trend bars turned green, securing a 28 pip profit.
Strategy Tips
- Focus on major pairs during active sessions for stronger trend moves and better pip potential.
- Confirm both trend bars and price action support before entering trades to reduce false signals.
- Place stop losses at logical swing points or significant support/resistance levels.
- Take profits when the trend bars change color or after achieving 25-40 pip targets.
- Monitor the trading session and avoid low liquidity periods for safer entries.
- Use the mini dashboard to quickly assess spread, daily range, and current market activity before trading.
Download Now
Download the “price-action-indicator.ex4” Metatrader 4 indicator
FAQ
What does the mini dashboard display?
It shows the currency pair, current quote, spread, point value, daily and weekly ranges, and candlestick patterns for daily, weekly, and monthly charts.
What are stop hunting zones?
Stop hunting zones highlight areas where the market may trigger stop losses before continuing the trend.
They help traders avoid being prematurely stopped out.
Can I customize the indicator?
Yes. All visual elements, trend lines, Fibonacci levels, and dashboard settings can be adjusted via the input menu to suit your strategy.
Summary
The Price Action indicator for MT4 equips traders with a comprehensive set of tools to analyze price movements and trade efficiently.
With trend lines, Fibonacci retracements, trading sessions, stop hunting zones, and a mini dashboard, it delivers real-time market information at a glance.
This indicator helps identify pullbacks, trend breaks, and reversal opportunities, improving trade timing and risk management while keeping price action at the center of decision-making.


