About the RSI Colored Signals Indicator
The RSI Colored Signals Indicator is a high-performance tool designed to refine how you interpret Relative Strength Index data.
Unlike standard oscillators that keep you focused on a sub-window, this tool bridges the gap by printing entry signals directly on your main price chart.
It functions by identifying extreme exhaustion points where price is likely to reverse.
The indicator tracks momentum shifts and provides visual confirmation through colored lines and arrows.
This tool is particularly effective for traders who struggle with timing their entries during market pullbacks.
By integrating a green oversold line and a red overbought line in a separate window, it provides a dual-layer confirmation system.
You can easily adjust the sensitivity to match specific market conditions, such as high-volatility sessions or quiet overnight ranges.
Free Download
Download the “Color RSI with allert.mq4” MT4 indicator
Key Features
- Provides buy and sell arrows directly on the MT4 price chart to simplify entry timing.
- Includes a secondary oscillator window with color-coded lines for overbought and oversold zones.
- Allows full customization of RSI periods and level thresholds such as 70/30 or 80/20.
- Alerts traders to potential market reversals before they are fully visible in price action.
- Works across all timeframes from scalping charts to long-term daily swings.
- Integrates with trend-following filters like moving averages to improve win rates.
Indicator Chart
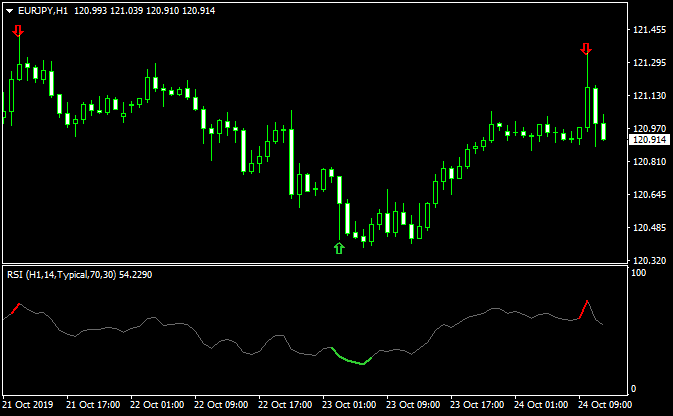
The chart displays the RSI Colored Signals Indicator identifying key reversal zones.
Green arrows appear when the indicator hits oversold levels, signaling a potential long entry.
Red arrows highlight overbought conditions for shorting opportunities.
The sub-window confirms these signals by changing the oscillator line color as it crosses the preset boundaries.

Guide to Trade with RSI Colored Signals Indicator
Buy Rules
- Wait for a green arrow to appear on the main price chart.
- Ensure the RSI line in the sub-window has dipped below the 30 level and turned green.
- Verify that price is trading above a long-term moving average to ensure you are trading with the trend.
- Open a long position at the close of the candle where the green arrow is confirmed.
Sell Rules
- Look for a red arrow to print on the main trading screen.
- Confirm that the RSI line has crossed above the 70 level and changed to a red color.
- Check that the overall market structure is bearish or that price is below a major EMA.
- Enter a short position once the signal candle closes and the red arrow remains fixed.
Stop Loss
- Place your stop loss a few pips below the most recent swing low for buy orders.
- Position the stop loss above the recent local peak or swing high for sell orders.
- Adjust the distance based on current market volatility to avoid being stopped out by noise.
Take Profit
- Exit the trade when an opposing arrow appears on the chart.
- Target a fixed reward-to-risk ratio of at least two-to-one for consistent growth.
- Consider closing the position when the RSI line reaches the opposite extreme level.
RSI Colored Signals + Awesome OC Indicator Forex Day Trading Strategy
This MT4 strategy combines the RSI Colored Signals indicator with the Awesome OC indicator for exact entry signals.
The RSI Colored Signals indicator shows green arrows for buy signals and red arrows for sell signals.
The Awesome OC histogram confirms trend direction.
Bars above zero indicate a bullish market, while bars below zero confirm bearish momentum.
This day trading approach works well on M15, M30, and H1 charts.
It is suitable for intraday traders who want simple but effective trend-and-signal confirmation.
The Awesome OC helps filter trades by confirming the dominant trend, while the RSI arrows give precise entry timing.
Buy Entry Rules
- The Awesome OC histogram is above zero, confirming a bullish trend.
- A green arrow from the RSI Colored Signals indicator appears.
- Enter a buy trade when both conditions are present.
- Set the stop loss 5 to 10 pips below the most recent swing low.
- Set a take profit target of 20 to 60 pips on M15 or M30, or 40 to 100 pips on H1.
Sell Entry Rules
- The Awesome OC histogram is below zero, confirming bearish momentum.
- A red arrow from the RSI Colored Signals indicator appears.
- Enter a sell trade when both conditions align.
- Set the stop loss 5 to 10 pips above the most recent swing high.
- Set the take profit target between 20 and 60 pips on M15 or M30, or 40 to 100 pips on H1.
Advantages
- Clear and easy-to-read entry signals.
- The trend filter reduces low-quality trades.
- Smooth integration of momentum and signal timing.
- Works well during active trading sessions.
- Gives multiple intraday opportunities.
Drawbacks
- Signals can be unreliable when the Awesome OC stays close to zero.
- RSI arrows may appear during weak momentum without follow-through.
- Whipsaws occur in tight consolidation periods.
- Pairs with high spreads may reduce profitability.
Case Study 1 — EUR/USD on H1
During the London session, the EUR/USD H1 chart showed the Awesome OC histogram rising above zero, confirming bullish momentum.
A green RSI arrow appeared shortly after.
A buy position was opened with the stop loss placed 5 pips below the recent swing low. A take profit of 80 pips was used.
Price pushed higher steadily, and the trade closed with around 78 pips profit.
Case Study 2 — GBP/JPY on M30
On the GBP/JPY M30 chart, the Awesome OC histogram moved below zero, indicating a bearish environment.
Soon after, a red RSI arrow appeared.
A sell order was placed with the stop loss set 10 pips above a recent swing high. A 50 pip take profit was targeted.
Price dropped sharply, and the trade reached 48 pips before reversing slightly.
Strategy Tips
- Avoid trading when the Awesome OC stays near zero for long periods.
- Use trailing stops to secure profits during extended moves.
- Check higher time frames to confirm the broader market direction.
- Focus on pairs with tight spreads for best results.
- Always wait for both the histogram trend and arrow signal before entering.
Download Now
Download the “Color RSI with allert.mq4” Metatrader 4 indicator
FAQ
How do I reduce false signals in a trending market?
The RSI Colored Signals Indicator is most effective in range-bound environments.
To avoid bad trades during a strong trend, only take buy signals when the market is in an uptrend and only take sell signals during a downtrend.
Combining this with a 200-period moving average is a reliable way to filter out counter-trend signals that often fail.
Can I change the RSI period settings for faster signals?
Yes, you can modify the RSI period in the indicator inputs.
A lower number like 7 or 9 will make the indicator more sensitive and provide more frequent signals.
A higher number like 14 or 21 will smooth out the movements and provide fewer, but often more reliable, signals for swing trading.
What are the best levels to use for the overbought and oversold zones?
While the default settings are 70 and 30, many traders prefer 80 and 20 for more conservative entries.
These tighter levels ensure you only enter when the market is extremely stretched.
If you are trading in a very quiet market, you might move them to 65 and 35 to catch more frequent moves.
Summary
The RSI Colored Signals Indicator is an excellent upgrade for any trader relying on momentum oscillators.
It removes the guesswork of looking back and forth between price and the RSI window.
By providing direct on-chart arrows, it helps you stay focused on price action while still benefiting from mathematical momentum data.
While it performs best in ranging markets, its flexibility allows it to be a cornerstone of a trend-following system when used with proper filters.


