
The S & R Forex Block indicator for Metatrader is a support and resistance trading system that delivers solid buy/sell trading signals.
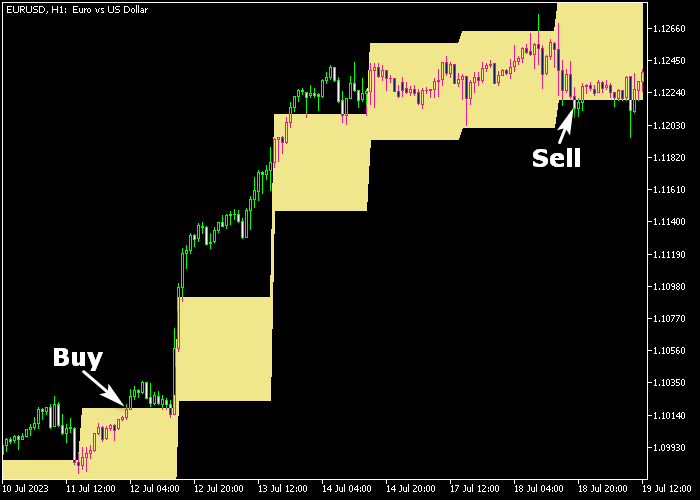
When applied to the price chart, the indicator displays a sequence of yellow blocks.
To recognize strong bullish and bearish market trends, observe the pattern of S & R blocks:
- A series of upward-trending S & R blocks signifies a strong bullish market.
- A series of downward-trending S & R blocks indicates a robust bearish market.
You can customize various indicator inputs and parameters, such as the period, price, and colors, to align with your specific preferences.
The S & R Forex Block indicator is compatible with all trading instruments accessible on the MT5 charting platform.
Download Indicator
Trading Chart Example
The picture below shows what the S & R Forex Block indicator looks like when applied to the MT5 chart.
How To Buy And Sell With The S & R Forex Block Indicator?
Find a simple trading strategy below:
Buy Signal
- A buy signal is provided when the candle closes above the high of the yellow colored S & R block.
- Open a long trade and place a stop loss below the yellow colored block.
- Exit the buy trade for a minimal risk-to-reward ratio of 2.5.
- Alternatively, await a sell signal before closing the buy position.
Sell Signal
- A sell signal is provided when the candle closes below the low of the yellow colored S & R block.
- Open a short trade and place a stop loss above the yellow colored block.
- Exit the sell trade for a minimal risk-to-reward ratio of 2.5.
- Alternatively, await a buy signal before closing the sell position.
Download Now
S&R Forex Block Indicator and Forex Trendy Indicator MT5 Trading Strategy
Overview
This strategy uses the Forex Trendy Indicator to determine the prevailing trend direction and the S&R Forex Block Indicator to identify critical support and resistance levels for precision trade entries.
By combining both tools, traders can align entries with the trend while timing them around key reaction zones.
Timeframe
Recommended for 1-hour (H1), 4-hour (H4), and daily (D1) charts for better accuracy and trend clarity.
Indicators Used
- Forex Trendy Indicator – reveals the current trend direction.
- S&R Forex Block Indicator – displays major support and resistance blocks based on price history.
Buy Entry Rules
- The Forex Trendy Indicator confirms an uptrend (bullish signal).
- Price pulls back to a strong support block displayed by the S&R Indicator.
- Wait for a bullish candlestick formation at or near the support level (e.g., bullish engulfing, pin bar).
- Enter a buy trade after confirmation.
- Place a stop-loss just below the support block.
- Set the take-profit at the next visible resistance block or use a trailing stop for trade management.
Sell Entry Rules
- The Forex Trendy Indicator confirms a downtrend (bearish signal).
- Price retraces to a defined resistance block on the S&R Indicator.
- Wait for a bearish candlestick pattern at the resistance (e.g., bearish engulfing, shooting star).
- Enter a sell trade after confirmation.
- Place a stop-loss just above the resistance block.
- Take profit at the next support block or use a dynamic trailing stop.
Tips for Best Results
- Use this strategy only when both indicators agree: trend direction and price reacting to a support or resistance level.
- Avoid trading during low-volume sessions or around major news releases.
- Use higher timeframes for trend direction and zoom into lower timeframes for entry triggers.
Conclusion
This combination strategy helps traders stay aligned with the dominant market trend while using precise support and resistance levels for entries.
The Forex Trendy Indicator keeps you trading in the right direction, and the S&R Forex Block Indicator provides optimal zones to enter or exit trades with confidence.
Frequently Asked Questions
How Do I Install This Custom Indicator On Metatrader 5?
- Open the MT5 trading platform
- Click on the File menu button located at the top left part of the platform
- Click on Open Data Folder > MQL5 folder > Indicators
- Copy the SR_Cloud.mq5 indicator file in the Indicators folder
- Close and restart the trading platform
- You will find the indicator here (Navigator window > Indicators)
- Drag the indicator to the chart to get started with it!


