About the Sadukey Forex Indicator
The Sadukey Forex Indicator for MT4 identifies profitable buy and sell trends directly on your currency chart.
It displays trend signals using colored dots, allowing traders to quickly spot potential entries and exits without manually analyzing price action.
Blue dots indicate buy signals, while red dots signal selling opportunities.
This indicator is beginner-friendly yet powerful enough for experienced traders.
It works on multiple currency pairs and timeframes, providing clear guidance for short-term and swing trading.
By following the signals and reversing positions when opposite signals appear, traders can potentially improve their win rate and trade efficiency.
Free Download
Download the “I-sadukey.mq4” indicator for MT4
Key Features
- Automatically identifies buy and sell trends using colored dots
- Blue dots for buy signals and red dots for sell signals
- Appears directly on the main MT4 chart window
- Supports multiple timeframes and currency pairs
- Helps traders quickly identify trend direction
- Simple to use for beginners and advanced traders alike
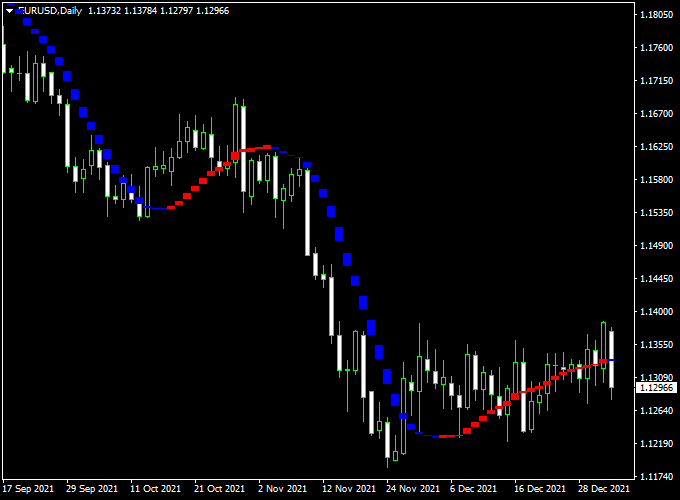
Indicator Chart
The chart below shows the Sadukey Forex Indicator in action.
Blue and red dots mark buy and sell signals, allowing traders to enter or reverse positions based on trend changes.
This visual guidance helps to quickly follow profitable trends.

Guide to Trade with the Sadukey Forex Indicator
Buy Rules
- Enter a buy trade when a blue Sadukey dot appears
- Confirm with overall trend direction or support levels if desired
- Reverse the position once a red dot appears
Sell Rules
- Enter a sell trade when a red Sadukey dot appears
- Confirm with trend direction or resistance levels if desired
- Reverse the position once a blue dot appears
Stop Loss
- Place a few pips below the previous low for buys
- Place a few pips above the previous high for sells
Take Profit
- Set at the next key support/resistance level
- Or exit when the opposite dot signal appears
Practical Tips
- Use higher timeframe trends to confirm dot signals and reduce false entries
- Combine with support/resistance levels for more reliable entries and exits
- Monitor for dot reversals to quickly reverse positions
- Test on a demo account to get a feel for dot timing and sensitivity
- Pair with trend-following indicators for added confidence on long-term trades
Sadukey + Entry Take Profit Intraday Strategy for MT4
This intraday trading strategy combines the Sadukey Forex Indicator with the Entry Take Profit Forex Winner Indicator for MT4.
The goal is to capture quick market movements during active trading sessions using a clear combination of trend direction and entry confirmation.
The Sadukey indicator displays blue dots for a bullish trend and red dots for a bearish trend.
The Entry Take Profit indicator provides blue arrows for buy signals and red arrows for sell signals.
When used together, they create a simple visual system that helps filter false entries and improves accuracy in fast markets.
This strategy works best on intraday timeframes such as M5, M15, or M30.
It performs well on major forex pairs like EURUSD, GBPUSD, and XAUUSD during the London or New York sessions where volatility is strongest.
Buy Entry Rules
- Wait for the Sadukey indicator to show blue dots, confirming an uptrend.
- Enter a buy trade when a blue upward arrow appears from the Entry Take Profit indicator.
- Place the stop loss 8–15 pips below the recent swing low.
- Set take profit at 1.5 to 2 times the stop loss distance, or close when Sadukey turns red.
- Optional: move stop loss to breakeven after the trade gains 10 pips.
Sell Entry Rules
- Wait for the Sadukey indicator to show red dots, confirming a downtrend.
- Enter a sell trade when a red downward arrow appears from the Entry Take Profit indicator.
- Place the stop loss 8–15 pips above the recent swing high.
- Set take profit at 1.5 to 2 times the stop loss distance, or exit when Sadukey turns blue.
- Optional: close half of the position once 10 pips are secured.
Advantages
- Combines clear visual confirmation of both trend and entry.
- Filters out many false signals during ranging periods.
- Easy to use and suitable for both beginners and experienced traders.
- Effective for short intraday trades with small stop losses.
- Can be applied to several currency pairs and timeframes.
Drawbacks
- Less effective during sideways or flat markets.
- Signals can appear late during strong volatility.
- Requires manual trade management for consistent results.
- Performance depends on market session and pair volatility.
Example Case Study 1: EURUSD M15
During the London session, Sadukey showed blue dots signaling an uptrend.
A blue arrow appeared at 1.1052, confirming a buy setup.
The trade was entered with a stop loss at 1.1045 and a target at 1.1068.
The price moved quickly in favor and hit the target for a gain of about 16 pips within 20 minutes.
Example Case Study 2: GBPUSD M5
In the New York session, Sadukey displayed red dots while a red arrow appeared at 1.2820.
A sell trade was opened at 1.2818 with a stop loss at 1.2830 and a take profit target at 1.2794.
The trade reached the target for 24 pips profit within 40 minutes before the trend switched to blue.
Strategy Tips
- Focus on active sessions such as London and New York for stronger moves.
- Avoid trading during high-impact news announcements.
- Limit trades to one or two currency pairs to understand their patterns.
- Use small, consistent risk per trade (around 1–2% of account size).
- Backtest both indicators on your preferred pairs and timeframes.
- Exit trades promptly when the dot color changes against your direction.
Download Now
Download the “I-sadukey.mq4” indicator for Metatrader 4
FAQ
How does the Sadukey Forex Indicator work?
It automatically plots blue and red dots on the chart to indicate buy and sell trends, helping traders follow profitable movements.
Can it be used on any timeframe?
Yes, it works across all MT4 timeframes, from M1 to H4, and with any currency pair.
Do I need other indicators to trade effectively?
While it can be used alone, combining with trend or support/resistance indicators improves accuracy and trade timing.
How do I set the indicator?
Settings allow you to adjust dot sensitivity and display style. Customize based on your trading style and preferred timeframe.
Summary
The Sadukey Forex Indicator is a simple yet effective tool for identifying profitable buy and sell trends on MT4 charts.
With blue and red dots marking key signals, traders can quickly spot trend changes and make informed decisions.
It works on multiple timeframes and currency pairs, making it suitable for both beginners and experienced traders.
For better performance, combine Sadukey with trend-following tools or support/resistance analysis.
Reversing positions on opposite dot signals allows traders to follow trends dynamically and potentially improve profitability.
This lightweight, easy-to-use indicator is a valuable addition to any trading strategy.


