The simple Intraday Support & Resistance Forex indicator for Metatrader 5 can be used for precise buy and sell trade entry.
The indicator scans the intraday chart for key S&R levels and draws them on the chart in the form of two colored clouds.
Key takeaways:
- The green colored intraday support/resistance cloud indicates a bullish trend.
- The light-violet colored intraday support/resistance cloud indicates a bearish trend.
The S&R filling cloud colors can be easily changed to whatever colors you like to use.
The following indicator inputs can be modified: filling color, and value.
First, familiarize yourself with this technical indicator and test it on a demo account.
It supports all time frames and Forex pairs.
Download Indicator 🆓
Simple intraday support resistance.mq5 Indicator (MT5)
Chart Example
The following chart shows what the simple Intraday Support & Resistance indicator looks like when applied to the MT5 chart.

How To Buy And Sell Forex Pairs With The simple Intraday Support & Resistance Indicator?
Find a simple trading example below:
Buy Signal
- A buy signal occurs when the green colored support/resistance cloud is displayed on the chart.
- Open a buy trade and place your stop loss 3 pips below previous swing low support.
- Close the buy trade for a reward to risk ratio of at least 2.0, or wait for a sell signal.
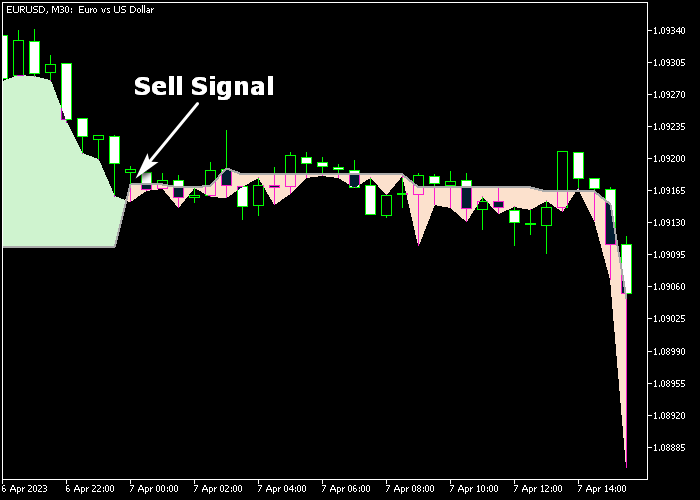
Sell Signal
- A sell signal occurs when the light-violet colored support/resistance cloud is displayed on the chart.
- Open a sell trade and place your stop loss 3 pips above previous swing high resistance.
- Close the sell trade for a reward to risk ratio of at least 2.0, or wait for a buy signal.
Download Now 🆓
Simple intraday support resistance.mq5 Indicator (MT5)
Frequently Asked Questions
How Do I Install This Custom Indicator On Metatrader 5?
- Open the MT5 trading platform
- Click on the File menu button located at the top left part of the platform
- Click on Open Data Folder > MQL5 folder > Indicators
- Copy the Simple intraday support resistance.mq5 indicator file in the Indicators folder
- Close and restart the trading platform
- You will find the indicator here (Navigator window > Indicators)
- Drag the indicator to the chart to get started with it!
How Do I Edit This Indicator?
- Click in the open chart with your right mouse button
- In the dropdown menu, click on Indicator List
- Select the indicator and click on properties
- Now you can edit the inputs, colors, levels, scale and visualization
- Finally click the OK button to save the new configuration


