About the Stochastic on Bollinger Bands Indicator
The Stochastic on Bollinger Bands indicator for Metatrader 4 is a powerful overbought/oversold trend indicator, and it can be used for trade entry and exit with high accuracy.
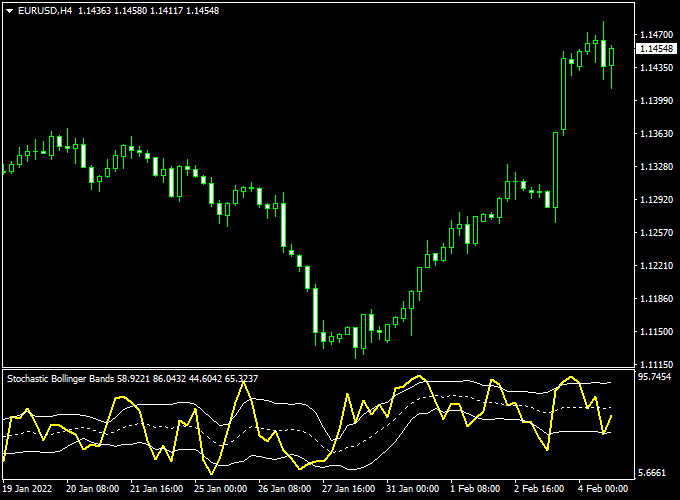
The indicator appears as Bollinger Bands with the RSI signal line plotted onto it in the bottom chart of the trading platform, creating a unique visual representation of market energy.
This indicator type works very well for identifying short-term trade opportunities, specifically for scalping and day trading.
Because it is exceptionally lightweight, you can monitor several pairs simultaneously without compromising platform stability.
Free Download
Download the “Stochastic bollinger bands.mq4” indicator for MT4
Key Features
- It combines momentum and volatility analysis into a single, easy-to-read oscillator window.
- The indicator utilizes a yellow signal line to mark precise overbought and oversold triggers.
- It helps traders identify high-probability reversal zones during active market hours.
- The tool is effective across all timeframes, particularly for M1, M5, and M15 intraday trading.
Indicator Chart
The Stochastic on Bollinger Bands indicator chart features a separate window at the bottom of the screen containing three bands and a central signal line.
The bands expand and contract based on market volatility, while the yellow signal line tracks the immediate price momentum.
When the yellow line moves outside the bands and then crosses back in, it signals that the current price extension has reached its limit and a correction is likely.

Guide to Trade with Stochastic on Bollinger Bands Indicator
Trading with this tool involves identifying when momentum has reached a volatility extreme and is beginning to revert toward the mean.
Buy Rules
- Monitor the indicator window for the yellow line to drop below the lower Bollinger Band.
- Open a buy trade when the yellow RSI signal line crosses back above the lower Bollinger band from below.
- Confirm the entry by ensuring the overall market trend is currently up on a higher timeframe.
- Verify that the signal occurs near a known horizontal support level on the main chart.
Sell Rules
- Watch for the yellow signal line to rise above the upper Bollinger Band into the overbought zone.
- Open a sell trade when the yellow RSI signal line crosses back below the upper Bollinger band from above.
- Confirm the signal by ensuring the overall market trend is down to maintain a higher success rate.
- Check the main price chart for bearish candlestick confirmation, such as a pin bar or engulfing pattern.
Stop Loss
- Secure your buy entry by placing the stop loss a few pips below the most recent swing low.
- Protect your sell trade by positioning the stop loss slightly above the latest swing high.
- Adjust your stop placement based on the current market volatility to avoid being stopped out by minor noise.
- Always maintain a disciplined risk-per-trade strategy to preserve your account equity.
Take Profit
- Exit the trade when the yellow signal line reaches the opposite Bollinger Band.
- Lock in gains at a 1:1.5 or 1:2 risk-to-reward ratio for consistent account growth.
- Consider closing the position if the signal line begins to flatten out near the middle band.
- Target major historical support or resistance zones as logical points to liquidate the trade.
Stochastic on Bollinger Bands + Magic Trend Indicator Forex Scalping Strategy
This scalping strategy combines the Stochastic on Bollinger Bands Forex Indicator MT4 with the Magic Trend Forex Indicator MT4.
The Stochastic on Bollinger Bands signals potential reversals based on RSI behavior relative to Bollinger Bands.
The Magic Trend indicator confirms the market direction with a green line for bullish trends and a red line for bearish trends.
By combining trend confirmation with momentum-based reversal signals, traders can efficiently capture short-term moves.
Buy Entry Rules
- Confirm the Magic Trend line is green, indicating an uptrend.
- Wait for the yellow RSI line on the Stochastic on Bollinger Bands indicator to cross back above the lower Bollinger Band from below.
- Enter a buy trade at the close of the confirming candle.
- Place a stop loss below the recent swing low or below the lower Bollinger Band.
- Take profit targets: 5–12 pips on M1, 10–20 pips on M5, 15–25 pips on M15 charts.
Sell Entry Rules
- Confirm the Magic Trend line is red, indicating a downtrend.
- Wait for the yellow RSI line on the Stochastic on Bollinger Bands indicator to cross back below the upper Bollinger Band from above.
- Enter a sell trade at the close of the confirming candle.
- Place a stop loss above the recent swing high or above the upper Bollinger Band.
- Take profit targets: 5–12 pips on M1, 10–20 pips on M5, 15–25 pips on M15 charts.
Advantages
- Combines trend direction and momentum-based reversal signals for higher-probability scalping trades.
- Works across multiple intraday time frames.
- Helps avoid counter-trend trades by confirming trend with Magic Trend.
- Applicable to multiple highly liquid currency pairs.
Drawbacks
- Scalping can be affected by sudden volatility spikes, especially on exotic pairs.
- Signals may fail during extended ranging or sideways markets.
- Indicator signals can sometimes lag, causing entries after part of the move has occurred.
Case Study 1: GBPJPY M5 – London Session
During the London session, GBPJPY displayed the Magic Trend line in green, confirming an uptrend.
The Stochastic RSI crossed above the lower Bollinger Band at 162.45.
A buy trade was entered with a stop loss at 162.30.
Price moved to 162.60 within 18 minutes, yielding 15 pips.
Trend and reversal alignment contributed to a reliable scalping trade.
Case Study 2: USDCHF M1 – New York Session
USDCHF on the M1 chart showed the Magic Trend line in red, signaling a downtrend.
The Stochastic RSI crossed below the upper Bollinger Band at 0.9125.
A sell trade was entered with a stop loss at 0.9132.
Price fell to 0.9115 in 12 minutes, producing a 10-pip profit.
Strategy Tips
- Only enter trades when both the Magic Trend and Stochastic on Bollinger Bands signals align.
- Focus on high-liquidity pairs during active trading sessions for more reliable scalping.
- Keep risk per trade small (1–2% of account) due to the fast-paced nature of scalping.
- Be cautious with highly volatile pairs like GBPJPY, as sudden moves may trigger stop losses prematurely.
Download Now
Download the “Stochastic bollinger bands.mq4” indicator for Metatrader 4
FAQ
How does this differ from the regular Stochastic oscillator?
While a standard Stochastic uses fixed levels like 20 and 80, this indicator uses dynamic Bollinger Bands as its boundaries.
This means the overbought and oversold levels change based on how much the market is actually moving.
During high volatility, the bands widen, and during low volatility, they contract, helping you avoid false signals that occur when the market is trending strongly.
Can I use this for 5-minute scalping?
Yes, the Stochastic on Bollinger Bands is excellent for 5-minute scalping. It helps you catch the “mini-cycles” of the market.
To increase your results, only take buy signals when the trend on the 1-hour chart is bullish, and only take sell signals when the 1-hour trend is bearish.
This helps you trade the pullbacks within a larger move.
Is the indicator lightweight for older computers?
Absolutely. The indicator is coded to be very lightweight and efficient. It calculates data quickly without consuming significant CPU resources.
This ensures that even if you have several charts open with different timeframes, your MetaTrader 4 platform will remain fast and responsive during the busiest trading sessions.
Summary
The Stochastic on Bollinger Bands for MT4 is an effective momentum tool that assists in determining the appropriate timing for market entries.
By offering a dynamic view of price extremes, it helps you avoid the common mistake of chasing the market when it is already overstretched.
This tool helps traders maintain a consistent routine by highlighting levels where the market is statistically likely to return to its average.
Using this indicator allows you to filter high-risk trades and focus on high-conviction momentum shifts.


