
About the Stochastic Divergence Indicator
The Stochastic Divergence indicator for Metatrader 4 identifies bullish and bearish divergences between price and the Stochastic indicator with high accuracy.
These divergences are a powerful tool that can help to detect early trend reversals on any time frame, making it a staple for both scalpers and swing traders.
The indicator appears in a separate MT4 chart window in the form of buy and sell signal arrows plus divergence lines that connect key price points.
Free Download
Download the “Stochastic Divergence.mq4” indicator for MT4
Key Features
- Automates the identification of regular and hidden divergences across all timeframes.
- Includes color-coded signal arrows to mark the exact moment a reversal pattern is confirmed.
- Draws divergence lines directly on the oscillator to help you interpret momentum shifts.
- Offers a versatile foundation for building a robust trend-reversal trading strategy.
Indicator Chart
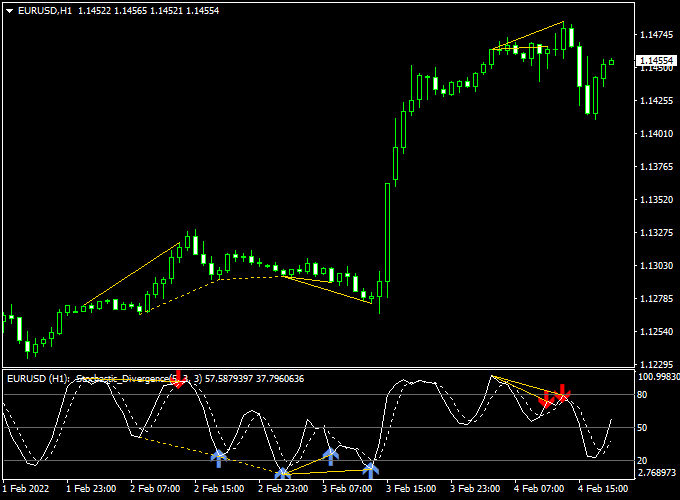
The Stochastic Divergence indicator chart displays the price action in the main window while the oscillator runs in a sub-window below.
The chart shows blue arrows and lines for bullish setups and red arrows for bearish signals.
By observing how the divergence lines connect price peaks to oscillator peaks, a trader can easily identify when the current trend is losing the strength necessary to continue.
Guide to Trade with the Stochastic Divergence Indicator
Trading with this system requires waiting for the divergence lines to lock and the signal arrows to appear for confirmation.
Buy Rules
- Monitor the oscillator for a bullish divergence where price makes a lower low but the indicator makes a higher low.
- Wait for a blue arrow to be printed on the chart as a buy signal.
- Confirm the signal by ensuring the current candle has closed in a bullish manner.
- Verify that the signal occurs near a major horizontal support level on the daily or hourly chart.
Sell Rules
- Watch for a bearish divergence where price makes a higher high while the oscillator makes a lower high.
- Enter a sell trade as soon as a red arrow is printed on the chart.
- Confirm the entry by waiting for the signal candle to close and lock in the bearish momentum.
- Ensure the broader market trend on a higher timeframe aligns with the bearish signal.
Stop Loss
- Secure your buy entry by placing the stop loss a few pips below the most recent swing low.
- Protect your sell trade by positioning the stop loss slightly above the latest swing high.
- Always follow a fixed risk-per-trade strategy to ensure long-term account sustainability.
Take Profit
- Exit the trade when an opposite signal arrow appears on the chart.
- Target a 1:2 risk-to-reward ratio to maintain a positive statistical edge.
- Consider closing the position if the Stochastic lines reach the opposite extreme boundary.
- Liquidate the trade at the next major horizontal support or resistance zone.
Stochastic Divergence + Zero Lag Moving Average MT4 Scalping Strategy
The combination of the Stochastic Divergence Indicator for MT4 and the Zero Lag Moving Average Indicator for MT4 provides a fast and accurate scalping approach.
It’s ideal for traders who prefer clear entries and minimal lag.
This setup is suitable for both beginners and experienced traders who prefer shorter time frames, such as M5 or M15 charts.
It works best during active market sessions, such as those in London or New York, where price movements are sharper and more predictable.
The Stochastic Divergence indicator identifies early reversal points by detecting divergences between the price and the stochastic oscillator.
A blue arrow signals a bullish divergence, indicating a potential upward reversal, while a red arrow highlights a bearish divergence, suggesting a possible downward move.
The Zero Lag Moving Average complements it by confirming the trend direction.
When its histogram is above zero, the market is in a buy phase; when it’s below zero, the market is bearish.
Together, they form a clear and reliable scalping system with minimal lag and early warning signals.
Buy Entry Rules
- Wait for a blue arrow to appear on the Stochastic Divergence indicator (bullish divergence).
- Confirm that the Zero Lag Moving Average histogram is above the zero line.
- Open a buy trade at the close of the confirmation candle.
- Place a stop loss just below the recent swing low or 10 pips lower for tighter control.
- Set a take profit target of 15–40 pips, or exit when the histogram crosses back below zero.
Sell Entry Rules
- Wait for a red arrow on the Stochastic Divergence indicator (bearish divergence).
- Confirm that the Zero Lag Moving Average histogram is below the zero line.
- Open a sell position after the signal candle closes.
- Set a stop loss just above the recent swing high or around 10 pips higher.
- Take profit at 15–40 pips, or close the position when the histogram crosses above zero.
Advantages
- Combines divergence and trend confirmation for higher accuracy.
- Provides early entry signals before trend reversals fully develop.
- Low lag and fast signal confirmation thanks to the Zero Lag MA.
- Suitable for all major currency pairs and volatile cross pairs.
- Ideal for intraday and scalping setups with clear visual cues.
Drawbacks
- The divergence signal can appear too early, causing entries before the trend has fully reversed.
- Performance may vary across different pairs and time frames, requiring optimization and testing.
- The Zero Lag Moving Average can still react to sudden spikes, leading to whipsaws in volatile markets.
- The strategy may produce small profits per trade, so a strong risk-to-reward discipline is essential.
Example Case Study 1 – GBPJPY M15
On the GBPJPY M15 chart, a blue arrow appeared near the 190.60 level after a series of lower lows, while the stochastic showed a bullish divergence.
The Zero Lag Moving Average histogram is confirmed by crossing above zero.
A buy trade was entered at 190.75 with a 15-pip stop loss and a 35-pip target.
Within an hour, the price moved up steadily to 191.10, delivering a 35-pip gain.
The histogram stayed above zero throughout, confirming the short-term bullish momentum.
Example Case Study 2 – USDCHF M5
On the USDCHF M5 chart, a red arrow appeared near the 0.9180 resistance area, signaling a bearish divergence.
At the same time, the Zero Lag Moving Average histogram turned below zero, confirming bearish pressure.
A sell trade was opened at 0.9175, with a 10-pip stop loss and a 25-pip take profit.
The pair dropped quickly to 0.9150 within 40 minutes, yielding a clean 25-pip profit.
This setup demonstrated how the strategy captures short but reliable scalping moves during strong sessions.
Strategy Tips
- Focus on the most active sessions (London and New York) for better volatility and clearer divergence signals.
- Use trailing stops after a 20-pip gain to lock in profits during extended moves.
- Combine a higher time frame analysis (H1) to confirm the general trend direction before scalping.
Download Now
Download the “Stochastic Divergence.mq4” indicator for Metatrader 4
FAQ
How does this indicator help with hidden divergence?
Hidden divergence is often used by traders to find trend continuation points rather than reversals.
This indicator is specifically programmed to recognize these patterns where momentum suggests the primary trend is ready to resume after a pullback.
By providing specific lines for these setups, it helps you join a strong trend with much higher confidence than using a standard oscillator alone.
Can I adjust the sensitivity of the divergence detection?
Yes, you can modify the Stochastic periods in the settings to make the indicator more or less sensitive.
Shorter periods will result in more frequent signals for scalping, while longer periods will provide more stable signals for swing trading.
Most traders find that the default settings offer a balanced approach for the 15-minute and 1-hour timeframes.
Summary
The Stochastic Divergence for MT4 is an effective momentum tool that assists in determining the appropriate timing for market entries.
By offering a refined way to see the conflict between price and momentum, it helps you avoid the common trap of buying at the very top of a trend.
This tool helps traders maintain a consistent routine by highlighting levels where the market is statistically likely to reverse its path.
Using this indicator allows you to filter high-risk trades and focus on high-conviction momentum shifts.


