
The Support & Resistance levels II forex indicator scans for all minor and major support & resistance levels on any pair and timeframe.
Support levels are colored blue, while resistance levels are colored red.
S&R levels are a very important forex analysis tool used by many traders.
They are used to trade breakout signals, to identify good stop-loss levels and to take profits.
I personally like to set the indicator’s precision (inputs tab) to 2500.
This gives me the more important major support and resistance levels instead of the default mix of minor and major levels.
This indicator can be used as a standalone, especially to trade breakouts or in conjunction with other technical indicators or analysis tools.
Support & resistance work for scalping, day trading and swing trading.
Free Download
Download the “support-resistance-levels.ex4” MT4 indicator
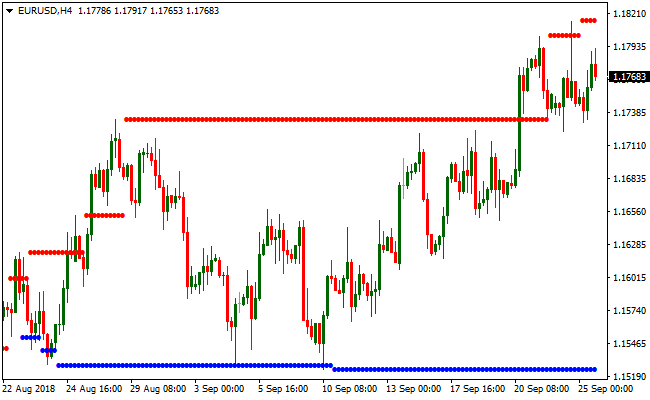
Indicator Chart (EUR/USD H4)
The EUR/USD 4-Hour chart below displays the Support & Resistance levels II Metatrader 4 Forex indicator in action.
Basic Trading Signals
Signals from the Support & Resistance levels II MT4 forex indicator are easy to interpret and goes as follows:
Buy Signal: Initiate a long trade when price breaks and closes above major resistance (red dotted line).
Sell Signal: Initiate a sell trade when price breaks and closes below major support (blue dotted line).
Trade Exit: Use your own method of trade exit.
Support Resistance Levels II + Zero Lag MACD Forex Scalping Strategy
This MT4 scalping strategy combines the structured price levels from the Support Resistance Levels II indicator with the momentum confirmation from the Zero Lag MACD indicator.
Support appears as blue dotted lines while resistance appears as red dotted lines.
The Zero Lag MACD provides the directional bias. When MACD is above zero, it signals bullish momentum and when it is below zero, it signals bearish momentum.
This strategy is designed for scalping on M5 and M15 charts. It works well on major pairs with good liquidity.
The goal is to use support and resistance levels as entry zones and the Zero Lag MACD as confirmation for momentum.
Buy Entry Rules
- Price must touch or come close to a blue support level.
- The Zero Lag MACD must be above the zero line.
- Enter a buy trade when price rejects the support and forms a bullish confirmation candle.
- Place the stop loss a few pips below the support line.
- Take profit at the next red resistance level or when MACD weakens toward zero.
Sell Entry Rules
- Price must touch or come close to a red resistance level.
- The Zero Lag MACD must be below the zero line.
- Enter a sell trade when price rejects the resistance and forms a bearish confirmation candle.
- Place the stop loss a few pips above the resistance line.
- Take profit at the next blue support level or when MACD weakens toward zero.
Advantages
- Clear support and resistance zones help define precise entries.
- Zero Lag MACD adds fast momentum confirmation for quick scalping decisions.
- Works well on major pairs with low spreads.
- Simple rules make it suitable for new scalpers.
Drawbacks
- Sideways markets may produce false entries near levels.
- Thin-volume periods reduce the reliability of support and resistance reactions.
- Stop losses can be hit quickly if a level breaks sharply.
- Requires active monitoring on lower time frames.
Case Study 1
On EURUSD M5, price moved downward toward a blue support level at 1.09850.
It touched the level and rejected with a bullish candle closing back above 1.09855.
At the same time the Zero Lag MACD crossed above zero which confirmed bullish momentum.
A buy trade was entered at 1.09855 with a stop loss at 1.09820.
The next red resistance was located at 1.09930.
Price climbed steadily and reached 1.09928, generating a gain of about 7 pips before momentum weakened.
Case Study 2
On USDJPY M15, price rallied into a red resistance level at 149.45.
A rejection candle formed with a clear upper wick and the Zero Lag MACD dropped below zero at the same time.
A sell trade was opened at 149.44 with a stop loss at 149.60.
The next blue support was at 149.10.
Price fell strongly during the next session and reached 149.12, giving a profit of about 32 pips before momentum slowed.
Strategy Tips
- Avoid trading when support and resistance levels are clustered too closely together.
- Wait for a clear rejection candle before entering, not just a touch of the level.
- Exit early if MACD starts pulling back toward zero even before reaching the opposite level.
- Keep stop losses tight because scalping relies on small but frequent opportunities.
Download Now
Download the “support-resistance-levels.ex4” Metatrader 4 indicator
MT4 Indicator Characteristics
Currency pairs: Any
Platform: Metatrader 4
Type: Chart pattern indicator
Customization options: Variable (Contract Step, Precision, Bars Count) Colors, width & Style.
Time frames: 1-Minute, 5-Minutes, 15-Minutes, 30-Minutes, 1-Hour, 4-Hours, 1-Day, 1-Week, 1-Month
Type: Support & Resistance


