
About the Target Bands Signal Indicator
The Target Bands Signal indicator for MT4 is a trend-following trading tool that plots dynamic price bands directly on the chart.
These bands adapt to market direction and slope upward or downward depending on prevailing momentum.
Unlike static channel indicators, Target Bands adjust continuously as price evolves.
When the trend strengthens, the bands expand and follow price action, offering traders natural zones to look for pullback-based entries.
The indicator highlights potential trade opportunities by plotting signal circles whenever price touches a band.
These signals are not meant to be traded blindly. Instead, they work best when aligned with the current trend direction.
In bullish conditions, traders focus on buy signals forming near the lower blue band.
In bearish conditions, sell signals near the upper light-brown band become the priority.
This directional filtering helps traders stay aligned with momentum rather than fighting it.
Free Download
Download the “target-bands-indicator.ex4” MT4 indicator
Key Features
- Dynamic target bands that adapt to market direction.
- Visual signal circles when price touches the bands.
- Clear trend slope indication for directional bias.
- Designed for pullback entries within trends.
Indicator Chart
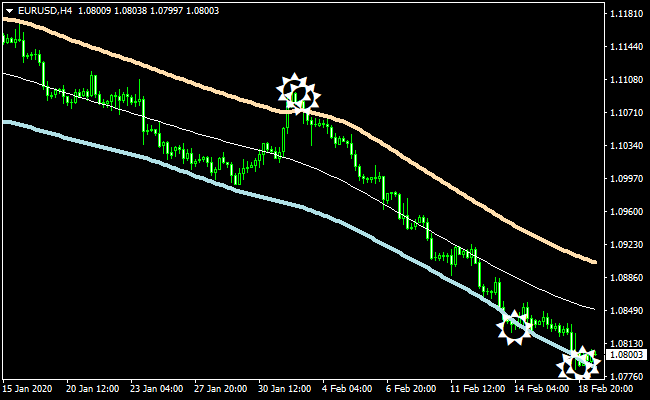
The chart shows the Target Bands Signal indicator applied to an MT4 price chart.
The blue lower band and light-brown upper band adjust with the trend direction.
Signal circles appear when price reaches a band, highlighting potential entry zones that align with the prevailing trend.
Guide to Trade with Target Bands Signal Indicator
Buy Rules
- Confirm that the target bands are sloping upward.
- Open a buy trade when a signal circle appears at the lower blue band.
- Ensure price action shows bullish continuation potential.
- Avoid buy signals if the bands are flat or changing direction.
Sell Rules
- Confirm that the target bands are sloping downward.
- Open a sell trade when a signal circle appears at the upper light-brown band.
- Ensure price action supports bearish continuation.
- Avoid sell signals if trend direction is unclear.
Stop Loss
- Place the stop loss below recent support for buy trades.
- Place the stop loss above recent resistance for sell trades.
- Use swing highs or lows as alternative stop references.
Take Profit
- Target the opposite band as a first profit objective.
- Scale out of trades as price moves in favor.
- Use trailing stops to stay in strong trends.
- Exit trades if the band slope begins to flatten.
Target Bands + Trend Predictor Forex Scalping Strategy for MT4
This MT4 scalping strategy combines the power of the Target Bands Indicator and the Trend Predictor v1.0 Indicator.
It is designed for traders who want fast confirmations and clean entries on the M1 and M5 charts.
The Target Bands indicator provides dynamic support and resistance zones, helping you understand where the price may reverse or expand.
When the bands slope upward, the market is usually trending up.
When they slope downward, the market is often in a bearish phase.
The Trend Predictor confirms these moments with blue buy arrows and red sell arrows, making the system easy to read even for beginners.
This strategy works well during sessions with steady price movement, such as London and New York.
It is suitable for scalpers who want to execute many short trades each day, while keeping the rules simple and visual.
Both indicators complement each other, as the Target Bands define trend strength, while the Trend Predictor provides clear timing signals.
Buy Entry Rules
- Target Bands slope upward, and price stays above the middle band.
- A blue Trend Predictor arrow appears, signaling a buy opportunity.
- Enter the buy trade after the candle closes above the signal arrow.
- Place the stop loss a few pips below the lower Target Band.
- Set a take profit of 5 to 12 pips on M1 or 10 to 20 pips on M5.
Sell Entry Rules
- Target Bands slope downward, and price stays below the middle band.
- A red Trend Predictor arrow appears, signaling a sell opportunity.
- Enter the sell trade after the candle closes below the signal arrow.
- Place the stop loss a few pips above the upper Target Band.
- Set a take profit of 5 to 12 pips on M1 or 10 to 20 pips on M5.
Advantages
- Clear visual signals suitable for new and experienced traders.
- Works on both fast and steady market conditions.
- Scalping structure allows many opportunities per session.
- Simple rules avoid confusion or conflicting information.
- Targets are small, making trade management easy.
Drawbacks
- Noisy markets can create several false arrows.
- Trending sessions work better than slow sessions.
- Requires discipline with small stop losses.
- Not suitable for traders who dislike quick decision-making.
- Spreads on exotic pairs may reduce profitability.
Case Study 1
On EURUSD M5, during the London open, the Target Bands turned upward and widened slowly.
Price stayed above the middle band for several candles, which showed a strong bullish tone.
A blue Trend Predictor arrow printed after a brief pullback.
The long trade was taken at the candle close, and the stop loss was set below the lower band.
Within minutes price moved upward by 16 pips and hit the take profit.
The bands continued to slope upward, which confirmed that the trade followed the correct market direction.
Case Study 2
On GBPJPY M1 in a fast Asian-to-London transition, the Target Bands sloped downward.
Price kept rejecting the upper band as it moved lower.
A red Trend Predictor arrow appeared after a short consolidation.
The sell trade was opened on the next candle close.
The stop loss was placed above the upper band, which kept the risk small.
Price dropped sharply by 10 pips, and the target was reached.
Although GBPJPY moved fast, the clear slope of the bands made it easy to stay confident in the trade.
Strategy Tips
- The slope of the Target Bands is your main guide.
- An upward slope suggests bullish movement, while a downward slope suggests bearish movement.
- Use the Trend Predictor arrows for timing. Blue arrows mean potential buys, and red arrows mean potential sells.
- Focus on M1 and M5 for the best scalping conditions.
- Avoid trading right before major news events.
- Pairs with tight spreads like EURUSD or USDJPY are usually the most efficient.
- Wait for the candle to close before entering any signal to avoid early entries.
Download Now
Download the “target-bands-indicator.ex4” Metatrader 4 indicator
FAQ
Are all band touch signals tradable?
No, signals should only be taken in the direction of the trend. Countertrend signals tend to perform poorly.
How do I identify the trend direction?
The slope of the bands provides the primary trend indication.
Rising bands suggest bullish momentum, while falling bands suggest bearish momentum.
Can Target Bands be combined with other indicators?
Yes, many traders combine it with higher timeframe trend filters or price action confirmation for better timing.
Summary
The Target Bands Signal indicator for MT4 offers a disciplined way to trade pullbacks within trending markets.
By focusing on dynamic bands and directional filtering, it helps traders avoid chasing price.
Its visual signal system and adaptive band behavior make it suitable for both newer and experienced traders.
When used with proper confirmation and risk management, it can become a reliable tool for trend-based trade planning and execution.


