
The Trend Direction And Force Index indicator for Metatrader 5 follows the trend and provides both entry and exit levels.
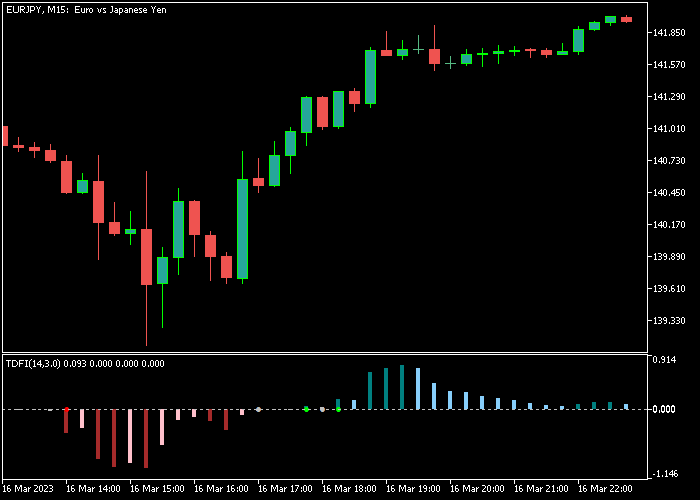
The indicator appears in a separate chart as colored histogram bars that oscillate above and below the neutral zero level.
- A trend bar above zero is bullish.
- A trend bar below zero is bearish.
The following indicator inputs can be fully adjusted: trend period, smoothing period, trigger up level, trigger down level, alert message, send email, and send push notifications.
Feel free to experiment with the indicator’s trend period and trigger levels.
First, familiarize yourself with this technical indicator and test it on a demo account.
It supports all time frames and Forex pairs.
Download Indicator 🆓
Trend Direction And Force Index.mq5 Indicator (MT5)
Chart Example
The following chart shows how the Trend Direction And Force Index indicator looks like when applied to the MT5 chart.
How To Buy And Sell Forex Pairs With The Trend Direction And Force Index Indicator?
Find a simple trading example below:
Buy Signal
- The first trend histogram bar above zero is a buy signal.
- Open a buy order and place your stop loss 3 pips below support.
- Close the buy trade for a reward/risk ratio of at least 1.5, or wait for a sell signal.
Sell Signal
- The first trend histogram bar below zero is a sell signal.
- Open a sell order and place your stop loss 3 pips above resistance.
- Close the sell trade for a reward/risk ratio of at least 1.5, or wait for a buy signal.
Download Now 🆓
Trend Direction And Force Index.mq5 Indicator (MT5)
Frequently Asked Questions
How Do I Install This Custom Indicator On Metatrader 5?
- Open the MT5 trading platform
- Click on the File menu button located at the top left part of the platform
- Click on Open Data Folder > MQL5 folder > Indicators
- Copy the Trend Direction And Force Index.mq5 indicator file in the Indicators folder
- Close and restart the trading platform
- You will find the indicator here (Navigator window > Indicators)
- Drag the indicator to the chart to get started with it!
How Do I Edit This Indicator?
- Click in the open chart with your right mouse button
- In the dropdown menu, click on Indicator List
- Select the indicator and click on properties
- Now you can edit the inputs, colors, levels, scale and visualization
- Finally click the OK button to save the new configuration