
The Trend Spotter Forex Indicator for Metatrader 5 is a reliable trading tool that provides non-repaint buy and sell signals to traders.
The indicator displays a series of consecutive colored trend bars on the price chart, making it easy to interpret the signals as follows:
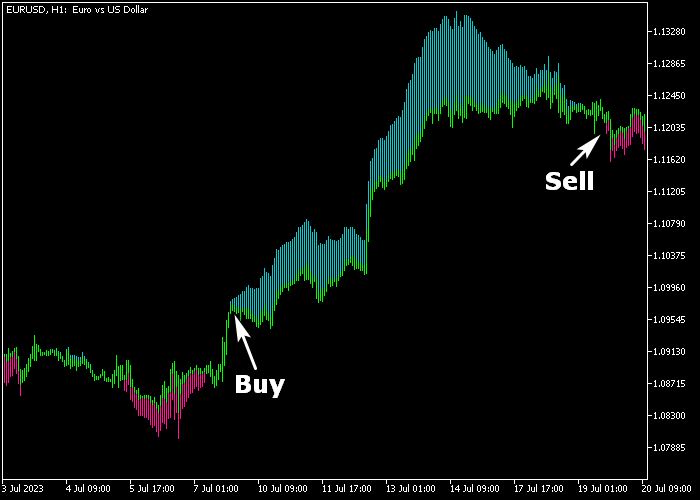
- Sea-green colored bars indicate a buy trade opportunity.
- Magenta colored bars indicate a sell trade opportunity.
You can adjust the fast Moving Average (MA) period, price type, smoothing method, slow MA period, colors and limit in points.
The Trend Spotter indicator is a versatile standalone trading tool, suitable for any currency pair and time frame.
Download Indicator 🆓
trend_manager.mq5 Indicator (MT5)
Chart Example
The picture below shows how the Trend Spotter Forex indicator looks when applied to the MT5 charting platform.
How To Buy And Sell Currency Pairs With The Trend Spotter Forex Indicator?
Find a simple trading example below:
Buy Signal
- A buy signal is triggered when the sea-green colored trend spotter bars get displayed on the price chart.
- Initiate a buy transaction and position a stop loss below the most recent swing low level.
- Exit the buy trade for a profit target of your preference, or await a sell signal.
Sell Signal
- A sell signal is triggered when the magenta colored trend spotter bars get displayed on the price chart.
- Initiate a sell transaction and position a stop loss above the most recent swing high level.
- Exit the sell trade for a profit target of your preference, or await a buy signal.
Download Now 🆓
trend_manager.mq5 Indicator (MT5)
Frequently Asked Questions
How Do I Install This Custom Indicator On Metatrader 5?
- Open the MT5 trading platform
- Click on the File menu button located at the top left part of the platform
- Click on Open Data Folder > MQL5 folder > Indicators
- Copy the trend_manager.mq5 indicator file in the Indicators folder
- Close and restart the trading platform
- You will find the indicator here (Navigator window > Indicators)
- Drag the indicator to the chart to get started with it!
How Do I Edit This Indicator?
- Click in the open chart with your right mouse button
- In the dropdown menu, click on Indicator List
- Select the indicator and click on properties
- Now you can edit the inputs, colors, levels, scale and visualization
- Finally click the OK button to save the new configuration