
About the Trend Value Indicator
The Trend Value indicator for MT5 is designed to deliver accurate trend-following signals for traders.
It combines moving averages with the Average True Range to detect momentum shifts and volatility expansion.
This combination helps filter weak moves and highlight higher probability trading opportunities.
The indicator prints blue arrows for buy setups and red arrows for sell setups directly on the price chart.
These signals appear when trend direction and volatility align.
Traders can adjust the moving average period, ATR period, ATR shift, and color scheme to match their strategy and preferred time frame.
Free Download
trendvalue.mq5 Indicator (MT5)
Key Features
- Combines moving averages with ATR for trend and volatility analysis.
- Customizable MA period, ATR period, and ATR shift.
- Works on all currency pairs and time frames.
- Signals appear directly on the price chart.
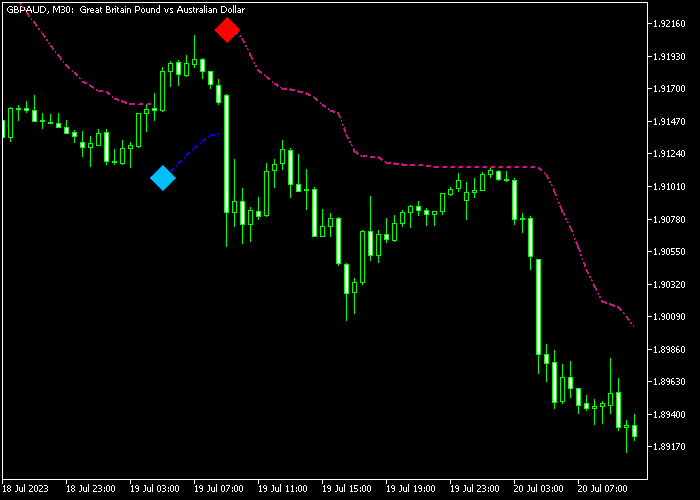
Indicator Chart
The Trend Value indicator appears directly on the main price chart.
Blue arrows mark bullish trend opportunities, while red arrows highlight bearish setups.
The arrows align with momentum expansion and help traders follow sustained directional moves.
Guide to Trade with the Trend Value Indicator
Buy Rules
- Open a buy trade when a blue arrow appears on the chart.
- Make sure price is trading above the recent moving average direction.
- Confirm that volatility is expanding in the direction of the trade.
- Avoid buying directly into a strong resistance level.
Sell Rules
- Open a sell trade when a red arrow appears on the chart.
- Ensure price is moving below the recent moving average direction.
- Confirm that volatility supports downward momentum.
- Avoid selling directly into a strong support level.
Stop Loss
- For buy trades, place the stop loss below the blue signal arrow.
- For sell trades, place the stop loss above the red signal arrow.
- Adjust the stop as the trend develops to protect open profit.
Take Profits
- Close buy trades when a red arrow appears.
- Close sell trades when a blue arrow appears.
- Alternatively, target the next major support or resistance zone.
- Use a fixed risk-to-reward ratio such as 1:2 or higher.
Buy Sell Trend Value Indicator and Dark Inversion MT5 Scalping Strategy
This scalping strategy combines fast trend confirmation with precise entry timing.
It uses the Buy Sell Trend Value Indicator for MT5 together with the Dark Inversion Indicator for MT5.
The idea is simple. Follow the active trend and use reversal signals to enter at the right moment.
The Buy Sell Trend Value indicator defines direction using arrows and dotted lines.
A blue arrow with a blue dotted line confirms a buy trend. A red arrow with a red dotted line confirms a sell trend.
The Dark Inversion indicator adds timing by showing green arrows for buy signals and red arrows for sell signals, often marking early pullbacks within a trend.
This strategy works best on fast timeframes such as M1 and M5.
It is ideal for scalpers who want quick entries with confirmation and minimal hesitation.
Buy Entry Rules
- Wait for a blue arrow with a blue dotted line from the Buy Sell Trend Value indicator.
- Wait for a green arrow from the Dark Inversion indicator.
- Enter a buy trade immediately after the green signal appears.
- Place the stop loss below the most recent swing low.
- Set take profit at the next short-term resistance or close the trade when a red arrow appears.
Sell Entry Rules
- Wait for a red arrow with a red dotted line from the Buy Sell Trend Value indicator.
- Wait for a red arrow from the Dark Inversion indicator.
- Enter a sell trade immediately after the red signal appears.
- Place the stop loss above the most recent swing high.
- Set take profit at the next short-term support or close the trade when a green arrow appears.
Case Study 1: Trend-Aligned Scalping Entry on EUR/USD
During a London session on the M5 timeframe, EUR/USD showed a blue arrow with a blue dotted line from the Buy Sell Trend Value indicator, confirming a bullish trend.
Price pulled back slightly, and shortly after, the Dark Inversion indicator printed a green arrow.
A buy trade was entered immediately after the signal. Price moved upward in line with the trend.
The trade was closed when a red arrow appeared, securing a fast scalping profit.
Case Study 2: Quick Reversal Within Trend on GBP/JPY
On the M1 timeframe, GBP/JPY displayed a red arrow with a red dotted line from the Buy Sell Trend Value indicator, confirming bearish conditions.
Price retraced upward briefly before the Dark Inversion indicator printed a red arrow, signaling continuation.
A sell trade was entered at that point. The stop loss was placed above the recent high.
Price dropped quickly and reached a nearby support level.
The position was closed there, capturing a short and efficient scalping move.
Download Now
trendvalue.mq5 Indicator (MT5)
FAQ
How does the ATR improve the signal quality?
The ATR measures market volatility. By combining it with moving averages, the indicator filters out weak trend signals and focuses on moves backed by expanding volatility.
Can I change the sensitivity of the arrows?
Yes. Adjusting the moving average period and ATR settings lets you make the signals faster or slower, depending on your trading style.
Is it suitable for ranging markets?
The indicator is trend-focused. During tight ranging conditions, signals may appear less frequently or produce shorter moves.
Summary
The Trend Value indicator identifies trend direction by combining moving averages with volatility analysis.
Blue arrows highlight bullish opportunities, while red arrows signal potential bearish moves.
Its customizable settings allow traders to adjust sensitivity and adapt the signals to different time frames and trading styles.
This technical tool performs strongly in trending markets and helps traders stay aligned with sustained price momentum.
By focusing on volatility-backed trend shifts, it supports more precise entries and timely exits across all major currency pairs.


