About the Trend Wave Oscillator Indicator
The Trend Wave Oscillator MetaTrader 4 indicator is a momentum-based oscillator designed to deliver timely buy and sell entries during trending market conditions.
It focuses on identifying overbought and oversold zones while aligning entries with directional momentum.
The indicator is plotted in a separate window below the price chart, keeping the main chart clean and easy to read.
The oscillator consists of two lines, one red and one lime, that interact around predefined signal levels.
These levels are marked at 50, 60, -50, and -60 and help define potential exhaustion and continuation zones.
Crosses between the two lines near these levels provide actionable trade signals.
To enhance usability, the Trend Wave Oscillator also displays colored signal dots and includes an optional sound alert.
This makes it suitable for traders who want quick visual and audio confirmation without constant screen monitoring.
Free Download
Download the “trend-wave-oscillator.ex4” MT4 indicator
Key Features
- Two-line oscillator for momentum and trend analysis.
- Overbought and oversold levels at +60 and -60.
- Colored signal dots for trade entry alerts.
- Optional sound alert for signal notifications.
- Compatible with scalping, day trading, and swing trading.
Indicator Chart
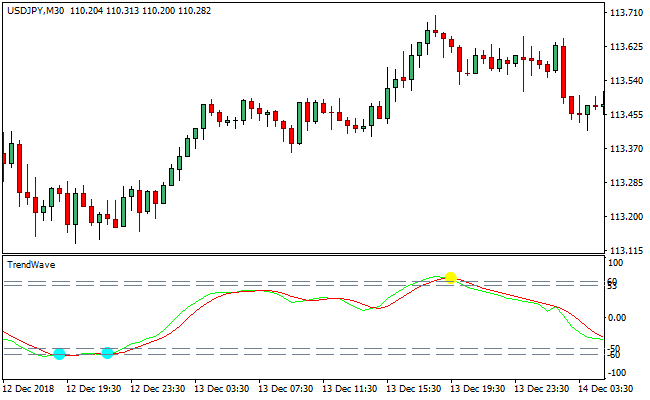
The chart below shows the Trend Wave Oscillator indicator displayed in a separate window on MetaTrader 4.
The red and lime lines cross near key signal levels, while aqua and yellow dots highlight buy and sell opportunities.
These visual elements help traders react quickly during active market sessions.

Guide to Trade with Trend Wave Oscillator Indicator
Buy Rules
- Wait for both oscillator lines to be below the -60 level.
- Watch for the red line to cross above the lime line.
- Confirm an aqua signal dot appears near the crossover.
- Enter a buy trade after the signal dot is formed.
Sell Rules
- Wait for both oscillator lines to be above the +60 level.
- Watch for the red line to cross below the lime line.
- Confirm a yellow signal dot appears near the crossover.
- Enter a sell trade after the signal dot is formed.
Stop Loss
- Place the stop beyond the most recent swing level.
- Keep the stop outside nearby consolidation areas.
- Avoid placing stops directly on the signal level.
- Adjust the stop as price moves in the trade direction.
Take Profit
- Target recent highs or lows in the trend direction.
- Hold the trade while momentum remains supportive.
- Exit partially near extended price moves.
- Close the trade if the lime line crosses extreme levels.
MT4 Trend Wave + Gann Trend Oscillator Day Trading Strategy
This day trading strategy blends the signal precision of the Trend Wave Oscillator with the trend filtering strength of the Gann Trend Oscillator MTF.
The Trend Wave Oscillator prints blue dots for buy opportunities and yellow dots for sell opportunities.
At the same time, the Gann Trend Oscillator illustrates the broader trend through blue histogram bars representing bullish momentum and violet bars indicating bearish pressure.
Combined, they offer a structured intraday trading method that works well on M5, M15, and M30 charts.
The Trend Wave Oscillator helps with timing entries, and the Gann Trend Oscillator ensures trades follow overall market direction.
This strategy is suitable for day traders who want clean setups, clear rules, and consistent intraday opportunities.
Buy Entry Rules
- The Gann Trend Oscillator histogram must be blue.
- A blue dot must appear on the Trend Wave Oscillator.
- The blue dot should form during a stable blue histogram period or just after the histogram switches from violet to blue.
- Enter at the opening of the next candle.
- Place stop loss below the latest minor swing low.
- Take profit at twice the stop loss distance or exit when the histogram turns violet.
Sell Entry Rules
- The Gann Trend Oscillator histogram must be violet.
- A yellow dot must appear on the Trend Wave Oscillator.
- The yellow dot should appear while the histogram is violet or directly after it shifts from blue to violet.
- Enter at the opening of the next candle.
- Place a stop loss above the latest swing high.
- Take profit at a 1:2 risk-to-reward or exit when the histogram turns blue.
Advantages
- Clear trend confirmation reduces bad entries.
- Momentum-based entry dots help traders time trades accurately.
- Suitable for multiple intraday timeframes.
- Easy to follow and beginner-friendly.
- Works well in high-volatility sessions.
Drawbacks
- Weak performance during sideways markets.
- The histogram may switch colors during choppy price action.
- Dot signals may lag during rapid reversals.
- Day trading requires close monitoring.
Case Study 1
On EURUSD M15 during the London session, the Gann Trend Oscillator shifted to blue after a clean breakout above earlier consolidation.
A blue dot printed two candles later on the Trend Wave Oscillator.
The trader entered at the next candle with a 12-pip stop loss placed beneath a small pullback low.
Momentum picked up quickly, and the price advanced 28 pips within the next 40 minutes.
The take profit at 24 pips was reached smoothly.
The histogram remained blue throughout the move, confirming strong bullish flow.
Case Study 2
On GBPJPY M5 during early New York trading, the Gann Trend Oscillator turned violet after a sharp downward push.
Shortly after, a yellow dot printed as the price retested a minor resistance zone.
The trader entered a sell at the next candle, using a 15-pip stop loss above the swing high.
Volatility increased, and GBPJPY dropped rapidly, reaching a 34-pip take profit target within 20 minutes.
The histogram stayed violet for the entire duration of the trade, giving strong directional confidence.
Strategy Tips
- Use this strategy during London or New York sessions when volatility is stronger.
- Avoid trading when histogram colors change frequently without direction.
- Combine session timing with this strategy to improve pip potential.
- If the histogram changes color against your trade, consider tightening stops or exiting early.
Download Now
Download the “trend-wave-oscillator.ex4” Metatrader 4 indicator
FAQ
What do the signal dots represent?
Aqua dots indicate potential buy opportunities near oversold levels.
Yellow dots highlight potential sell opportunities near overbought levels.
What is the purpose of the sound alert?
The alert notifies traders when a new signal dot appears.
This allows monitoring multiple charts without constant screen focus.
Summary
The Trend Wave Oscillator MT4 indicator offers a fast and visually intuitive way to trade trending markets.
By combining line crossovers, overbought and oversold levels, and signal dots, it simplifies the entry process.
Its flexibility across different trading styles and built-in alert feature make it a practical choice for traders who value timely signals and clean chart presentation.


