The Tushar Chande’s DMI Metatrader 5 forex indicator is used to determine overbought and oversold market conditions of an asset of interest.
The indicator is quite similar to the Relative Strength Index (RSI) in its workings.
The core difference between both aforementioned is that the RSI deploys a fixed number of time periods (commonly 14), while the DMI deploys a different time period as volatility changes.
The interpretations of the Tushar Chande’s DMI MT5 forex indicator is the same as the RSI, where readings below 30 are tagged oversold, readings above the 70 level are deemed overbought.
As the volatility within the underlying asset increases, the number of time periods used in the dynamic momentum index decreases, making the Tushar Chande’s DMI Metatrader 5 indicator more responsive to changing prices than the RSI.
Free Download
Download the “chandes_dmi.ex5” MT5 indicator
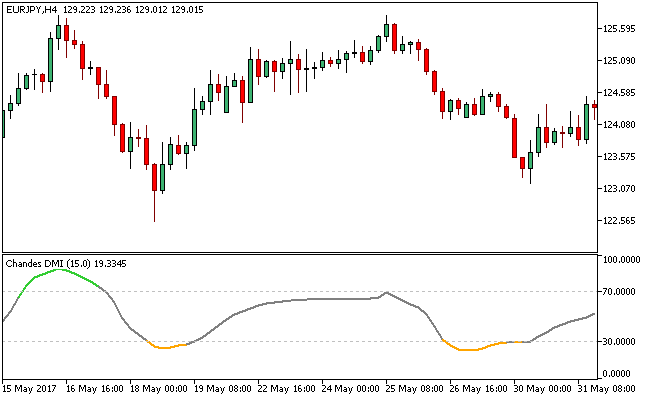
Example Chart
The EUR/JPY H4 chart below displays the Chandes DMI Metatrader 5 forex indicator in action

Basic Trading Signals
Buy Signal: Go long when the line of the chandes_dmi Metatrader 5 indicator breaks above the 50.00 level.
Sell Signal: Go short when the line of the chandes_dmi Metatrader 5 indicator breaks below the 50.00 level.
Exit buy trade: Close all buy orders if while a bullish trend is ongoing, price breaks below the overbought region (i.e. below the 70 level, where the indicator line changes from lime green to gray as it breaks below the 70 mark).
Exit sell trade: Close all sell orders if while a bearish trend is ongoing, price breaks above the oversold region (i.e. above the 30 level, where the indicator line changes from orange to gray as it surges above the 30 mark).
Tips: This version of the dmi Metatrader 5 indicator has additional smoothing in the form of RSX, which is added in a bid to make it more readable.
Download
Download the “chandes_dmi.ex5” Metatrader 5 indicator
MT5 Indicator Characteristics
Currency pairs: Any
Platform: Metatrader 5
Type: chart window indicator
Customization options: Variable (Price to use, Period of Standard Deviation, Period of smoothing, Mode of smoothing MA, Dynamic Momentum Index Period, Dynamic Periods Lower Bound, Dynamic Periods Upper Bound, Lower level, Upper level), Colors, width & Style.
Time frames: 1-Minute, 5-Minutes, 15-Minutes, 30-Minutes, 1-Hour, 4-Hours, 1-Day, 1-Week, 1-Month
Type: oscillator
Installation
Copy and paste the chandes_dmi.ex5 indicator into the MQL5 indicators folder of the Metatrader 5 trading platform.
You can access this folder from the top menu as follows:
File > Open Data Folder > MQL5 > Indicators (paste here)


