
About the Up Down Signals Indicator
The Up Down Signals forex MT4 indicator displays green and red dotted buy and sell signals directly on the main MetaTrader 4 chart.
Red dots positioned above the price indicate a downtrend, prompting traders to look for sell opportunities.
Conversely, green dots positioned below the price indicate an uptrend, encouraging traders to look for buy opportunities.
This indicator can be used on its own and performs well for scalping (M1, M5), day trading (M5, M15), and swing trading (M30, H1, H4, D1).
The default HL_period value is set to 3 but can be adjusted directly in the indicator’s Inputs tab.
Tweaking this setting allows you to better align the indicator with your trading preferences.
Free Download
Download the “up-down-indicator.mq4” MT4 indicator
Key Features
- Plots green and red dotted signals directly on the MT4 price chart.
- Identifies bullish and bearish trend direction in real time.
- Works across multiple timeframes and currency pairs.
- Customizable HL_period setting for signal sensitivity.
Indicator Chart
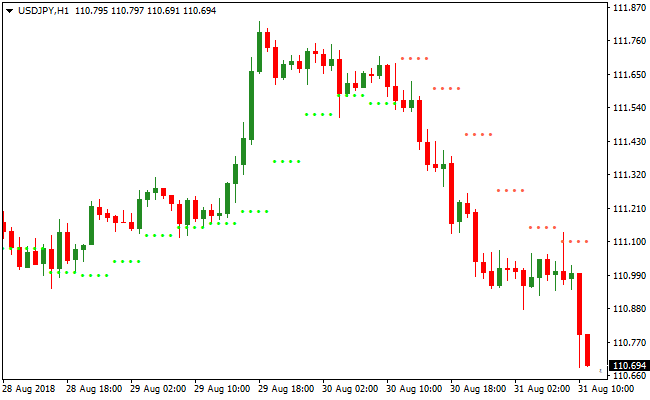
The image below shows the Up Down Signals indicator applied to a live price chart.
Green dots below the price highlight potential buy zones during an uptrend, while red dots above the price point indicate sell opportunities in a downtrend.
Guide to Trade with the Up Down Signals Indicator
Buy Rules
- Wait for the Up Down Signals indicator to plot green dots below the price.
- Confirm that price action respects the bullish direction.
- Enter a buy trade at the close of the signal candle.
- Avoid buying during strong consolidation or high-impact news.
Sell Rules
- Wait for the Up Down Signals indicator to plot red dots above the price.
- Confirm bearish momentum with recent price movement.
- Enter a sell trade at the close of the signal candle.
- Avoid selling into strong support zones.
Stop Loss
- Set the stop loss slightly below the nearest support level for buy trades.
- Set the stop loss just above the nearest resistance level for sell trades.
- Move the stop loss to break-even once the trade has moved in your favor by a predetermined number of pips.
Take Profit
- Close the trade when an opposite dot signal appears.
- Alternatively, target nearby support or resistance levels.
- Partial profits can be taken on strong price extensions.
- Let winning trades run during strong trends.
Up Down Signals and HalfTrend MT4 Trend Strategy
This MT4 forex strategy combines the precision of the Up Down Signals indicator with the strong trend filtering power of the HalfTrend 1.02 with Arrows indicator.
The goal of this approach is to trade only in the direction of the dominant trend while entering at optimal pullback moments.
The strategy works because both indicators complement each other perfectly.
Up Down Signals highlights precise reversal or continuation points using colored dots.
HalfTrend defines the broader trend direction using clear arrows. When both indicators align, the probability of a successful trade increases significantly.
This strategy performs best on M5, M15, and M30 timeframes.
It can be used on all major currency pairs and also works well on gold.
It is suitable for beginners who want visual clarity and for experienced traders looking for disciplined trend entries.
Buy Entry Rules
- Buy entry occurs when the Up Down Signals indicator plots green dots below the price.
- The HalfTrend indicator must show a blue arrow indicating a bullish trend.
- Enter the buy trade at the close of the confirmation candle.
- Stop loss is placed a few pips below the most recent swing low or below the HalfTrend line.
- Take profit can be set at a fixed 1:2 risk reward ratio or at the next visible resistance level.
Sell Entry Rules
- Sell entry occurs when the Up Down Signals indicator plots red dots above the price.
- The HalfTrend indicator must show a magenta arrow indicating a bearish trend.
- Enter the sell trade at the close of the confirmation candle.
- Stop loss is placed a few pips above the most recent swing high or above the HalfTrend line.
- Take profit can be set at a fixed 1:2 risk reward ratio or at the next visible support level.
Advantages
- Combines precise entry timing with reliable trend confirmation, improving overall trade accuracy.
- Filters out many low quality trades by enforcing strict trend direction rules.
- Adaptable to multiple timeframes, allowing both scalpers and intraday traders to use the same strategy.
- Works on a wide range of currency pairs and commodities without complex adjustments.
- Easy to learn and apply, making it suitable for traders with different experience levels.
Drawbacks
- Signals may appear later than price turning points during fast market reversals.
- Performance can decline in tight ranging markets where trends are not well defined.
- False signals can still occur during low volatility sessions or holiday trading hours.
Case Study 1
On EURUSD M15 during the London session, price was clearly trending upward.
The HalfTrend indicator displayed a blue arrow, confirming bullish momentum.
Shortly after a small pullback, the Up Down Signals indicator printed green dots below the candles.
A buy position was opened at candle close. The stop loss was placed below the recent swing low.
Price resumed its upward movement and reached the predefined take profit level, securing approximately 38 pips.
Case Study 2
On GBPJPY M5 during the New York session, the HalfTrend indicator showed a magenta arrow, signaling a bearish trend.
After a brief retracement, red dots appeared above price from the Up Down Signals indicator.
A sell trade was executed at confirmation. The stop loss was set above the recent high.
The market continued downward and hit the take profit target for a gain of around 22 pips.
Strategy Tips
- Always wait for both indicators to agree before entering a trade, explaining that Up Down Signals provides the timing while HalfTrend confirms the overall market direction.
- Avoid entering trades immediately after a HalfTrend arrow change, waiting instead for a small pullback to improve entry accuracy.
- Use higher timeframes like M15 or M30 to confirm the main trend before executing trades on lower timeframes.
- Protect profits by moving the stop loss to break even once price has covered at least the initial risk distance.
- Limit trading during low volatility or ranging conditions, as both indicators perform best in trending markets.
- Maintain consistent risk management by risking the same percentage per trade to achieve stable long term results.
Download Now
Download the “up-down-indicator.mq4” Metatrader 4 indicator
FAQ
Can the Up Down Signals indicator be used without other indicators?
Yes, the indicator can be traded on its own since it already reflects trend direction. Many traders still add confirmation tools to reduce false signals.
What does the HL_period setting control?
The HL_period setting adjusts how sensitive the indicator is to price movement. Lower values produce more signals, while higher values filter out noise.
Summary
The Up Down Signals indicator for MT4 offers a practical way to trade trends using simple visual signals.
Its green and red dot system removes guesswork and allows traders to focus on price direction rather than complex calculations.
The indicator adapts well across different trading styles and timeframes, making it suitable for both short-term and longer-term strategies.
Custom settings provide flexibility, while the clean chart display keeps analysis efficient.


