
About the Vidya Bands Forex Indicator
The Vidya Bands Forex indicator for MT4 is a trend-following bands system designed to adapt dynamically to changing market conditions.
It combines the Variable Index Dynamic Average with volatility calculations to form colored price bands that react to both momentum and price expansion.
Unlike static bands, Vidya Bands automatically adjust their width and direction based on market strength.
On the chart, the bands change color depending on market direction.
Green bands reflect bullish pressure, while red bands signal bearish conditions.
The indicator is especially effective for trend continuation setups and disciplined risk management.
Free Download
Download the “Vidya bands.mq4” indicator for MT4
Key Features
- Adaptive bands based on momentum and volatility.
- Colored trend indication for fast directional bias.
- Built-in pullback entry zones within trends.
- Automatic adjustment to changing market speed.
- Works on all timeframes and most currency pairs.
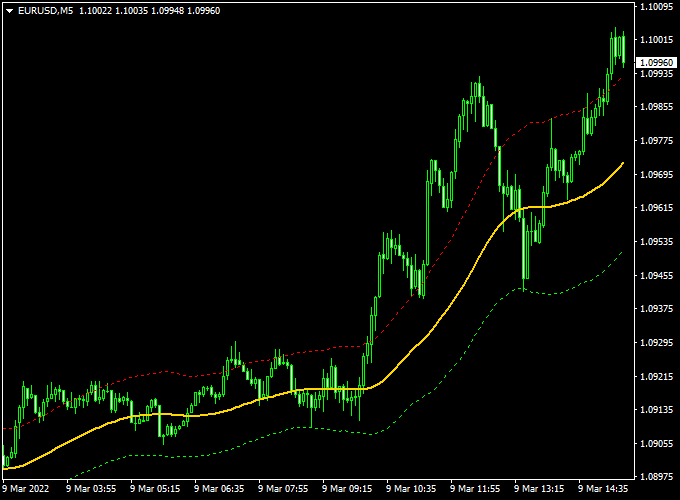
Indicator Chart
The green and red bands outline trend direction and highlight pullback areas where buy or sell setups appear.
Buy signals form when price reacts at the lower band in an uptrend, while sell signals appear at the upper band during downtrends.
Guide to Trade with Vidya Bands Forex Indicator
Buy Rules
- Confirm that the Vidya Bands are sloping upward.
- Wait for price to retrace toward the lower green band.
- Enter a buy trade when price respects the lower band and shows bullish reaction.
Sell Rules
- Confirm that the Vidya Bands are sloping downward.
- Wait for price to retrace toward the upper red band.
- Enter a sell trade when price rejects the upper band.
Stop Loss
- Place the stop loss a few pips beyond the recent swing high or low.
- Alternatively, use a fixed ATR-based stop for consistency.
Take Profit
- Set the first target near the opposite band.
- Trail the stop along the band during strong trends.
VIDYA Bands + Waddah Attar MT4 Forex Scalping Strategy
This scalping strategy combines the VIDYA Bands Forex Indicator for MT4 with the Waddah Attar Forex Scalping Indicator for MT4.
It is designed for fast-paced intraday trading on M1 and M5 charts, helping traders identify trend direction and precise entry points.
The VIDYA Bands indicate the market trend based on the slope of the bands, while the Waddah Attar histogram provides buy and sell signals.
How This Strategy Works
The VIDYA Bands indicator shows the trend direction: an upward slope indicates a buy trend, while a downward slope indicates a sell trend.
The Waddah Attar histogram confirms momentum with green bars signaling buy opportunities and red bars signaling sell opportunities.
Trades are taken only when both indicators align, increasing accuracy and reducing false signals.
Buy Entry Rules
- Confirm that the VIDYA Bands are sloping upward, indicating an uptrend.
- Wait for a green bar on the Waddah Attar histogram.
- Enter a buy trade at the close of the candle where both conditions are met.
- Set a stop-loss below the recent swing low.
- Take profit around 10–20 pips on M1 or 15–30 pips on M5, or exit when the bands slope down or a red histogram bar appears.
Sell Entry Rules
- Confirm that the VIDYA Bands are sloping downward, indicating a downtrend.
- Wait for a red bar on the Waddah Attar histogram.
- Enter a sell trade at the close of the candle where both conditions are met.
- Set a stop-loss above the recent swing high.
- Take profit around 10–20 pips on M1 or 15–30 pips on M5, or exit when the bands slope up or a green histogram bar appears.
Advantages
- Combines trend direction with momentum confirmation for higher probability trades.
- Works well on short-term charts for multiple intraday opportunities.
- Visual signals are clear and easy to follow.
- Helps avoid counter-trend trades and improves win rate.
Drawbacks
- Scalping requires constant attention and quick execution.
- Profit targets are small, requiring multiple trades for meaningful gains.
- High market noise on M1 charts may result in some premature exits.
Case Study 1 – EUR/USD M1 Chart
During the London session, the VIDYA Bands were sloping upward, and the Waddah Attar histogram turned green.
A buy trade was entered with a stop-loss 5 pips below the recent low.
Price reached the take-profit level of 12 pips within 8 minutes, and the trade was closed.
Case Study 2 – USD/JPY M5 Chart
On USD/JPY, the VIDYA Bands sloped downward, and a red Waddah Attar histogram bar appeared.
A sell trade was entered with a stop-loss 10 pips above the recent high.
The price moved to the take-profit target of 25 pips within 20 minutes before reversing.
Strategy Tips
- Focus on liquid pairs such as EUR/USD, GBP/USD, and USD/JPY for tighter spreads.
- Trade during the most active sessions for clearer trends and better execution.
- Adjust stop-loss levels based on the volatility of the currency pair.
- Ensure both the trend and momentum signals are aligned before entering a trade.
- Consider early exit if the trend slope changes or the histogram reverses, even before the take-profit target is reached.
Download Now
Download the “Vidya bands.mq4” indicator for Metatrader 4
FAQ
What makes Vidya Bands different from standard Bollinger Bands?
Vidya Bands adapt using momentum from the Chande Momentum Oscillator, not just price deviation.
This allows them to react faster during trend acceleration and stay tighter during pauses.
Can the band colors be customized in MT4?
Yes, the indicator settings allow traders to adjust band colors, periods, and volatility parameters to better match their trading style.
Is the indicator suitable for ranging markets?
Vidya Bands are optimized for trending conditions.
During ranges, signals may appear frequently, so filtering with higher timeframe trend direction is recommended.
Summary
The Vidya Bands Forex Indicator for MT4 offers a practical way to trade pullbacks within active trends.
Its adaptive calculations help traders stay aligned with momentum while avoiding late entries.
The colored bands provide fast visual feedback, making the indicator easy to use even during fast market movement.
With flexible settings and consistent behavior across markets, Vidya Bands can be integrated into both discretionary and rule-based strategies.
Traders looking for a responsive trend-following tool with built-in volatility awareness will find it a valuable addition to their MT4 platform.


