
The Volatility Quality Index Trend indicator for Metatrader 5 follows the trend and delivers newbie friendly buy & sell trading signals.
The indicator appears in a bottom chart window and can deliver multiple daily signals for any currency pair when trading off the lower time frames.
How does the Volatility Quality Index indicator work?
- A green colored line is a bullish trend.
- A red colored line is a bearish trend.
The indicator offers the following inputs and parameters: period, method, smoothing, and filter.
The 1-minute and 5-minute chart traders should focus on the London and New York trading sessions for best trading results.
First, familiarize yourself with this technical indicator and test it on a demo account.
It supports all time frames and Forex pairs.
Download Indicator 🆓
Volatility_Quality_Index.mq5 Indicator (MT5)
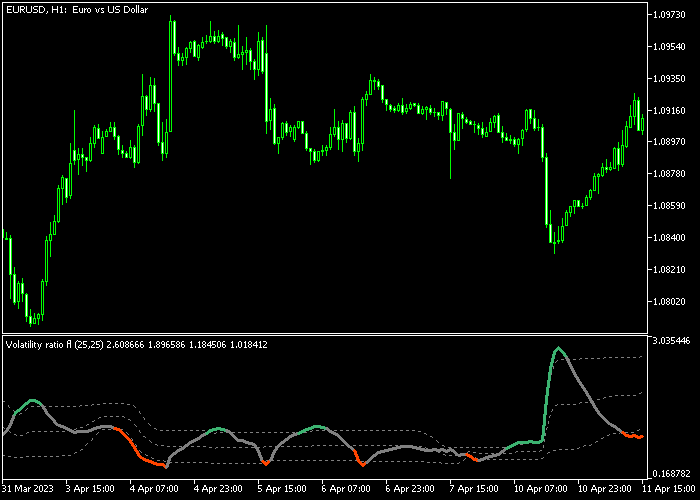
Chart Example
The following chart shows what the Volatility Quality Index Trend indicator looks like when applied to the MT5 chart.
How To Buy And Sell Forex Pairs With The Volatility Quality Index Trend Forex Indicator?
Find a simple trading example below:
Buy Signal
- The start of the green line is a buy signal.
- Execute a buy order and place your stop loss below the most recent support area.
- Exit the buy trade for a fixed profit target of your preference, or wait for a sell signal.
Sell Signal
- The start of the red line is a sell signal.
- Execute a sell order and place your stop loss above the most recent resistance area.
- Exit the sell trade for a fixed profit target of your preference, or wait for a buy signal.
Download Now 🆓
Volatility_Quality_Index.mq5 Indicator (MT5)
Frequently Asked Questions
How Do I Install This Custom Indicator On Metatrader 5?
- Open the MT5 trading platform
- Click on the File menu button located at the top left part of the platform
- Click on Open Data Folder > MQL5 folder > Indicators
- Copy the Volatility_Quality_Index.mq5 indicator file in the Indicators folder
- Close and restart the trading platform
- You will find the indicator here (Navigator window > Indicators)
- Drag the indicator to the chart to get started with it!
How Do I Edit This Indicator?
- Click in the open chart with your right mouse button
- In the dropdown menu, click on Indicator List
- Select the indicator and click on properties
- Now you can edit the inputs, colors, levels, scale and visualization
- Finally click the OK button to save the new configuration


