About the Waddah Attar Hidden Levels Indicator
The Waddah Attar Hidden Levels Indicator for MT5 displays calculated hidden price levels that help traders identify breakout zones with precision.
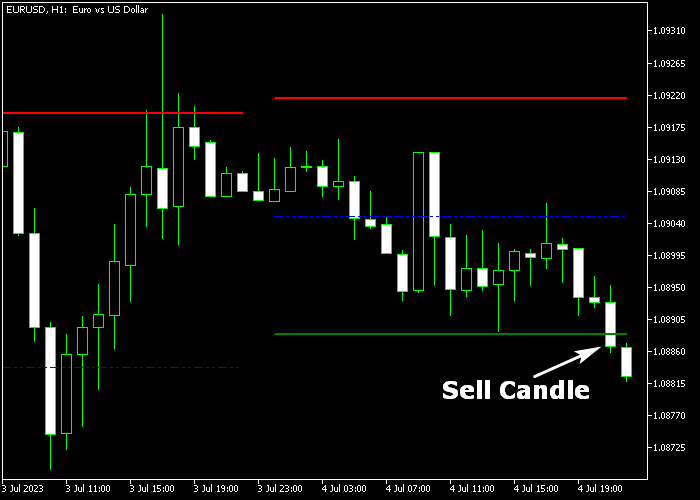
It plots a central blue line along with two outer levels marked in red and green directly on the price window.
The red and green lines are the primary focus.
When price breaks and closes above the red hidden level, it signals growing bullish momentum.
When price breaks and closes below the green hidden level, it signals increasing bearish pressure.
This logic allows traders to enter positions as price expands beyond compression phases.
The indicator supports full customization. You can adjust level labels, colors, and horizontal shift to match your trading template.
It works across all major Forex pairs and multiple timeframes, making it suitable for both intraday breakout traders and swing traders.
Free Download
waddah_attar_hidden_levels.mq5 Indicator (MT5)
Key Features
- Plots hidden breakout levels directly on the price window.
- Blue middle line for balance and reference.
- Red hidden level for bullish breakout signals.
- Green hidden level for bearish breakout signals.
- Customizable labels, colors, and horizontal shift.
- Designed for breakout and momentum-based strategies.
Indicator Chart
The Waddah Attar Hidden Levels Indicator appears on the main price window and draws three horizontal lines across the chart.
The blue line represents the central reference level, while the red and green lines define breakout zones.
A candle close beyond the red level signals a potential long setup. A candle close below the green level signals a potential short setup.

Guide to Trade with Waddah Attar Hidden Levels Indicator
Buy Rules
- Wait for a candle to close above the red hidden level line from below.
- Confirm that price continues to trade above the breakout level.
- Enter a buy trade at the close of the breakout candle.
- Avoid entering if the breakout lacks follow-through momentum.
Sell Rules
- Wait for a candle to close below the green hidden level line from above.
- Confirm that price remains below the breakout level.
- Enter a sell trade at the close of the breakout candle.
- Avoid trading if price quickly moves back inside the levels.
Stop Loss
- Place the stop loss below the most recent support zone for buy trades.
- Place the stop loss above the most recent resistance zone for sell trades.
- Position the stop beyond the breakout candle’s extreme to allow natural pullbacks.
Take Profit
- Close the full buy position when bullish momentum weakens and price fails to hold above the breakout level.
- Close the full sell position when bearish pressure fades and price reclaims the hidden level.
- Secure profits at the next significant reaction zone on the higher timeframe.
- Lock in gains progressively as price extends strongly in your favor.
Waddah Attar Breakout Scalping Strategy for MT5
This breakout scalping strategy combines dynamic support and resistance with momentum confirmation using the Waddah Attar Hidden Levels Indicator and the QQE of RSI Indicator.
It focuses on catching fast breakout moves with momentum alignment.
The Hidden Levels indicator identifies key support and resistance zones, where breakouts often lead to strong intraday moves.
The QQE indicator refines RSI behavior to provide clearer trend direction and momentum shifts, helping filter false breakouts.
By combining both tools, this strategy targets explosive price movements that occur when price breaks key levels with confirmed momentum.
Buy Entry Rules
- Wait for price to break and close above the red hidden level line.
- Confirm that the QQE line turns blue, indicating bullish momentum.
- Ensure the breakout candle shows strong bullish intent (large body or momentum close).
- Enter a buy trade immediately after the breakout candle closes.
- Place the stop loss below the breakout level or recent consolidation.
- Close the trade when the QQE line turns brown or when price falls back below the broken level.
Sell Entry Rules
- Wait for price to break and close below the green hidden level line.
- Confirm that the QQE line turns brown, signaling bearish momentum.
- Check that the breakout candle is strong and decisive.
- Enter a sell trade after the candle closes.
- Place the stop loss above the breakout level or recent structure.
- Close the trade when the QQE line turns blue or when price moves back above the broken level.
Case Study 1: GBPUSD M15 Buy Breakout
On GBPUSD M15, price approached a red hidden resistance level and eventually closed above it with a strong bullish candle.
The QQE line turned blue at the same time, confirming upward momentum. A buy trade was entered immediately after the breakout.
The move extended quickly as volatility increased.
The trade was exited for 42 pips profit when the QQE line turned brown and price slipped back below the breakout level.
Case Study 2: EURUSD M5 Sell Breakout
On EURUSD M5, price consolidated near a green hidden support level before breaking below it with momentum.
The QQE line turned brown, confirming bearish pressure. A sell trade was taken after the breakout candle closed.
Price dropped rapidly following the breakout.
The position was closed for a small 15 pip loss when the QQE line turned blue and price moved back above the level.
Download Now
waddah_attar_hidden_levels.mq5 Indicator (MT5)
FAQ
How are the hidden levels calculated?
The indicator uses an internal calculation method to detect breakout zones that are not always visible from recent swing highs and lows.
Does the Waddah Attar Hidden Levels Indicator repaint?
No. Once a candle closes beyond a hidden level, the breakout signal remains fixed and does not shift afterward.
Which timeframes work best with this indicator?
It performs strongly on M15, H1, and H4 charts where breakout momentum often develops with stronger continuation.
Can I customize the appearance of the levels?
Yes. You can adjust level labels, colors, and horizontal shift to align the indicator with your chart layout.
Summary
The Waddah Attar Hidden Levels Indicator provides defined breakout zones that support accurate market entries.
The red and green hidden levels act as direct momentum triggers once price closes beyond them.
With flexible settings and straightforward breakout logic, the indicator supports traders who focus on expansion moves and continuation trades.
Applied with disciplined execution, it enhances timing and trade precision.


