Wilder’s Relative Strength Index (RSI) indicator for Metatrader 5 is a popular momentum oscillator that identifies overbought and oversold market levels.
The RSI indicator oscillates between zero (extremely oversold) and 100 (extremely overbought).
According to the RSI technical indicator:
- RSI is overbought above 70.
- RSI is oversold below 30.
RSI formula: RSI = 100 – [100 / ( 1 + (Average of Upward Price Change / Average of Downward Price Change ) ) ]
The RSI indicator works best when combined with trend indicators, such as moving averages.
- In up trending markets, we look to buy when the RSI indicator is oversold (buy on dips).
- In down trending markets, we look to sell when the RSI indicator is overbought (sell on rallies).
- In range-bound markets, we can trade both overbought and oversold RSI signals.
Make yourself familiar with this indicator and test it first on a demo account. It supports all time frames and Forex pairs.
Download Indicator 🆓
Wilder’s Relative Strength Index.mq5 Indicator (MT5)
Chart Example
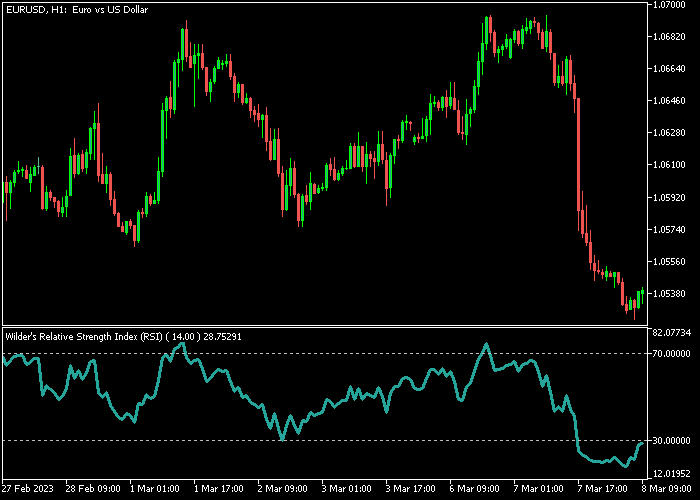
The following chart shows how the Wilder’s Relative Strength Index (RSI) indicator looks like when applied to the MT5 chart.

How To Buy And Sell Forex Pairs With The Wilder’s Relative Strength Index (RSI) Indicator?
Find a simple trading example below:
Buy Signal
- A buy signal occurs when the overall trend is upward and the RSI goes back above 30 from below.
- Open a buy trade and place your stop loss below the previous swing low.
- Close the buy trade near key resistance or go for a fixed profit target of your preference.
Sell Signal
- A sell signal occurs when the overall trend is downward and the RSI goes back below 70 from above.
- Open a sell trade and place your stop loss above the previous swing high.
- Close the sell trade near key support or go for a fixed profit target of your preference.
Download Now 🆓
Wilder’s Relative Strength Index.mq5 Indicator (MT5)
Frequently Asked Questions
How Do I Install This Custom Indicator On Metatrader 5?
- Open the MT5 trading platform
- Click on the File menu button located at the top left part of the platform
- Click on Open Data Folder > MQL5 folder > Indicators
- Copy the Wilder’s Relative Strength Index.mq5 indicator file in the Indicators folder
- Close and restart the trading platform
- You will find the indicator here (Navigator window > Indicators)
- Drag the indicator to the chart to get started with it!
How Do I Edit This Indicator?
- Click in the open chart with your right mouse button
- In the dropdown menu, click on Indicator List
- Select the indicator and click on properties
- Now you can edit the inputs, colors, levels, scale and visualization
- Finally click the OK button to save the new configuration


