About the XP Moving Average Indicator
The XP Moving Average indicator for MetaTrader 4 is a trend-following tool that belongs to the moving average family, with an added visual layer to reflect changing market conditions.
Its primary goal is to smooth price fluctuations while offering traders early insight into shifts in momentum.
The indicator appears as a single multi-colored line plotted directly on the price chart.
Each color segment reflects a different market state.
Red sections signal bullish pressure, green sections point to bearish conditions, and yellow sections highlight quieter or transitional market phases.
By filtering out short-term noise, the XP Moving Average helps traders stay focused on the broader price direction.
It works on any currency pair and timeframe, making it adaptable for scalping, intraday trading, or longer-term analysis.
Adjusting its parameters allows traders to control sensitivity and better align the indicator with their trading style.
Free Download
Download the “xp-moving-average.ex4” MT4 indicator
Key Features
- A multi-colored moving average displayed on the price chart.
- Red line segments indicate bullish market conditions.
- Green line segments indicate bearish market conditions.
- Yellow line segments reflect low-momentum or quiet sessions.
- Smooths price action to reduce false signals.
- Customizable parameters for sensitivity control.
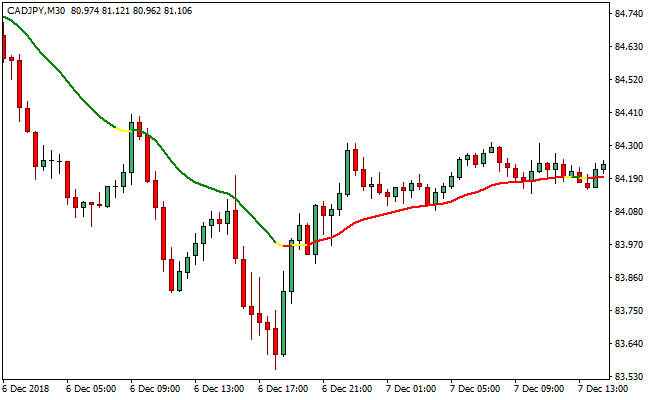
Indicator Chart
This chart example shows the XP Moving Average indicator applied to a live market.
The colored line follows price movement and changes color as market conditions shift, helping traders quickly assess trend direction and momentum strength.

Guide to Trade with XP Moving Average Indicator
Buy Rules
- Wait for the XP Moving Average line to turn red.
- Confirm that price is trading slightly above the moving average.
- Check that recent candles show bullish follow-through.
- Enter a buy trade after the color change is confirmed.
Sell Rules
- Wait for the XP Moving Average line to turn green.
- Confirm that price is trading slightly below the moving average.
- Ensure bearish momentum is present.
- Enter a sell trade after the color change is confirmed.
Stop Loss
- Place the stop loss a fixed number of pips on the opposite side of the XP Moving Average line.
- Increase the stop distance slightly when trading higher timeframes.
- Exit the trade if price closes decisively beyond the line against your position.
Take Profit
- Target the next visible support or resistance area.
- Lock in partial profits when price accelerates away from the moving average.
- Close the position when the line changes color against the trade.
XP Moving Average + Waddah Attar Forex Scalping Strategy for MT4
This strategy uses the XP Moving Average MT4 Indicator together with the Waddah Attar Forex Scalping Indicator MT4.
The XP Moving Average displays a colored line: when it is red, the trend is bullish; when it is green, the trend is bearish.
The Waddah Attar indicator shows a histogram: a green histogram bar signals buying strength and a red bar signals selling strength.
By combining trend direction with momentum strength, this scalping approach offers more reliable entries and clearer trade decisions.
This method is best used on short-term charts: M1, M5, or M15.
It is intended for scalpers who want to catch quick, high-probability moves aligned with minor trend shifts.
It works especially well during active trading sessions when volatility is sufficient to sustain small momentum swings.
Buy Entry Rules
- The XP Moving Average line must be red, indicating a bullish trend.
- The Waddah Attar histogram must produce a green bar, showing upward momentum.
- Enter a long position when the green histogram bar closes above its previous bar (or clearly rises) while the MA remains red.
- Place the stop loss just below the most recent swing low on the same timeframe.
- Set take profit at a distance equal to 1 to 1.5 times the stop loss, or trail the stop loss manually as the move continues.
Sell Entry Rules
- The XP Moving Average line must be green, indicating a bearish trend.
- The Waddah Attar histogram must produce a red bar, signaling downward momentum.
- Enter a short position when the red histogram bar closes below its previous bar (or falls sharply) while the MA stays green.
- Place the stop loss just above the most recent swing high on the same timeframe.
- Set take profit at 1 to 1.5 times the stop loss distance, or trail a stop manually in the direction of the move.
Advantages
- Simple trend-filtering via the XP Moving Average line.
- Momentum confirmation from the Waddah Attar histogram reduces false entries.
- Scalping style allows many small setups per session.
- Risk is defined clearly with stop loss and take profit rules.
- Works across multiple currency pairs and timeframes.
Drawbacks
- Stop losses may be tight and thus more often hit if the price spikes against the trade.
- Trailing stops manually can be difficult on M1 or M5 without quick reactions.
- Large spreads can make scalping less efficient, especially on less liquid pairs.
Example Case Study 1
On the EUR/GBP M5 chart, the XP Moving Average line turned red, indicating a bullish micro-trend.
Soon after, the Waddah Attar histogram printed a strong green bar, rising above the prior green bar.
A long trade was entered at the close of that bar.
The stop loss was placed just under a recent swing low about 10 pips away, and the take profit was set at 15 pips (1.5 × risk).
As price ticked upward, the trade hit its take profit within a few minutes, capturing a sharp but clean intraday move.
Example Case Study 2
On the AUD/NZD M1 chart during the New York session, the XP Moving Average turned green, signaling a short-term bearish move.
A bearish momentum shift appeared when the Waddah Attar histogram printed a solid red bar lower than the previous one.
A short was opened at the close of that red bar.
The stop loss was placed 8 pips above the recent swing high. A take profit target of 12 pips was used (1.5 × risk).
The pair quickly retraced downward, and the trade closed with profit before a small correction pulled the price back.
Strategy Tips
- Stick to one timeframe per session because mixing M1 and M15 trades in the same session may reduce focus.
- Avoid taking trades when the XP Moving Average line is flat or changing color frequently.
- During news events or high volatility, reduce trade size or skip trades because momentum may be erratic.
- Use a small trailing stop once the trade moves in favor, to lock in gains without giving up room.
- Keep a scalp journal to track win rate, average pips per trade, and which pairs work best with this setup.
Download Now
Download the “xp-moving-average.ex4” Metatrader 4 indicator
FAQ
What do the colors of the XP Moving Average mean?
Red indicates bullish conditions, green indicates bearish conditions, and yellow highlights low-momentum or transitional phases.
Is the XP Moving Average suitable for sideways markets?
No. Like most moving averages, it performs poorly during choppy or range-bound conditions.
Should the default settings be adjusted?
Adjusting the parameters can help fine-tune sensitivity and improve performance across different market environments.
Summary
The XP Moving Average MT4 indicator provides a visually intuitive way to track trend direction and changing market tone.
Its color-based design allows traders to read momentum at a glance while maintaining a clean chart.
By smoothing price action and filtering short-term noise, the indicator helps traders stay aligned with prevailing market direction.
Used in trending conditions and supported by additional analysis, the XP Moving Average can be a reliable component of a disciplined trading approach.


